


 5
5
Ethereum’s price is sitting near a zone that has often marked major cycle lows, according to an MVRV “pricing bands” chart shared by market analyst Ali Charts on X, citing Glassnode data.
$ETH MVRV bands flag a familiar “bottom zone”
The chart plots $ETH’s price (black line) against several MVRV-based bands, which use the market value to realized value ratio to map where the asset has historically looked overheated or deeply discounted.
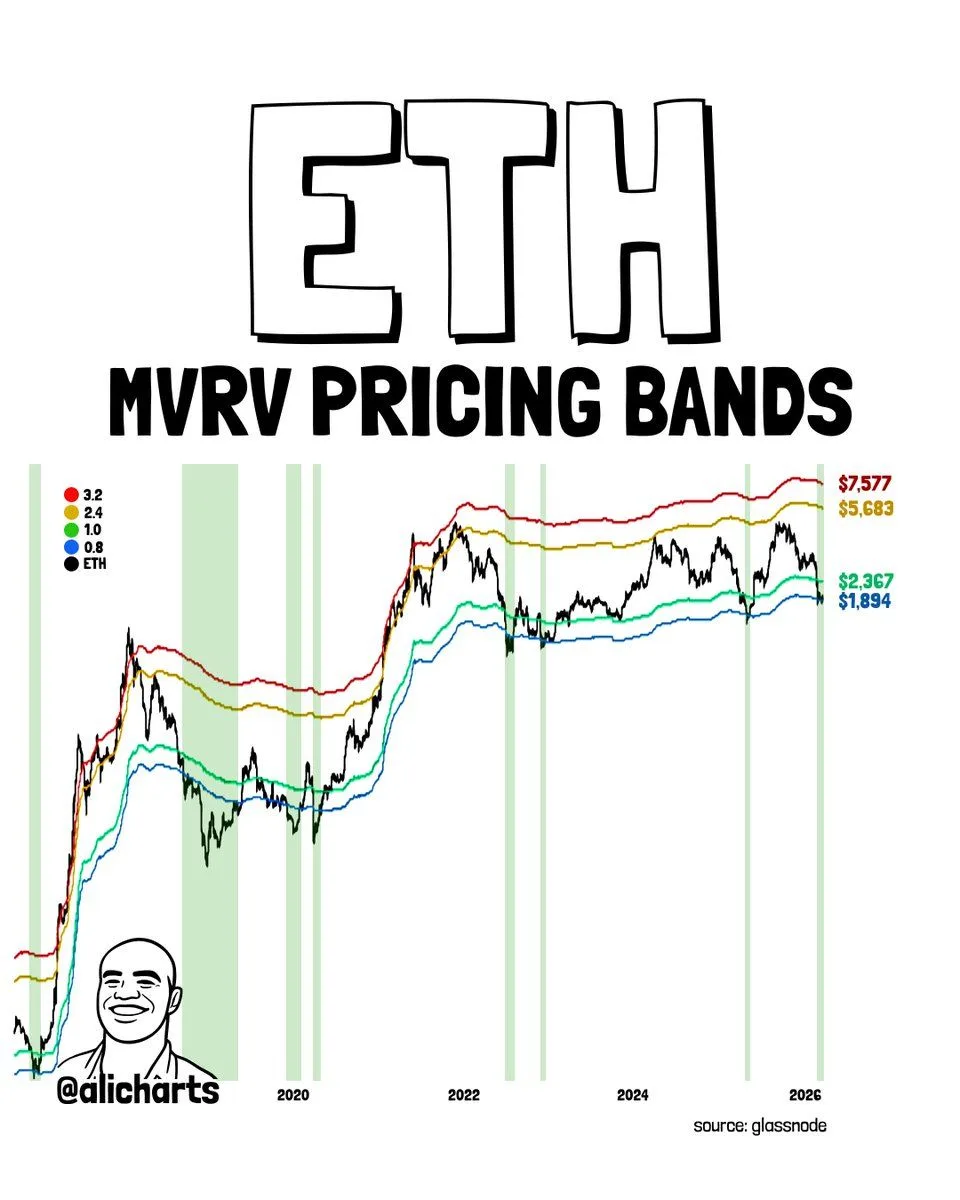
Ethereum MVRV Pricing Bands. Source: Glassnode/Ali Charts on X
On the right side of the chart, the upper bands sit at about $7,577 (3.2x, red) and $5,683 (2.4x, yellow). Meanwhile, the lower bands appear near $2,367 (1.0x, green) and $1,894 (0.8x, blue).
Ali Charts said $ETH is currently trading around the lower band region that has “historically aligned with market bottoms.” On the chart, past periods shaded in green show earlier phases when $ETH traded near or below these lower bands before later trend reversals.
MVRV bands are commonly used as a valuation framework rather than a timing tool. They compare today’s market price to the average on-chain cost basis implied by realized value, then place that relationship into zones that have repeated across prior cycles.
Ethereum Wave Count Points to One More High Before Wave
Meanwhile, More Crypto Online posted an updated Elliott Wave count for $ETH that matches the structure on the Bitcoin chart. The 30 minute setup keeps $ETH inside wave (3) and shows wave c of (3) still unfinished.
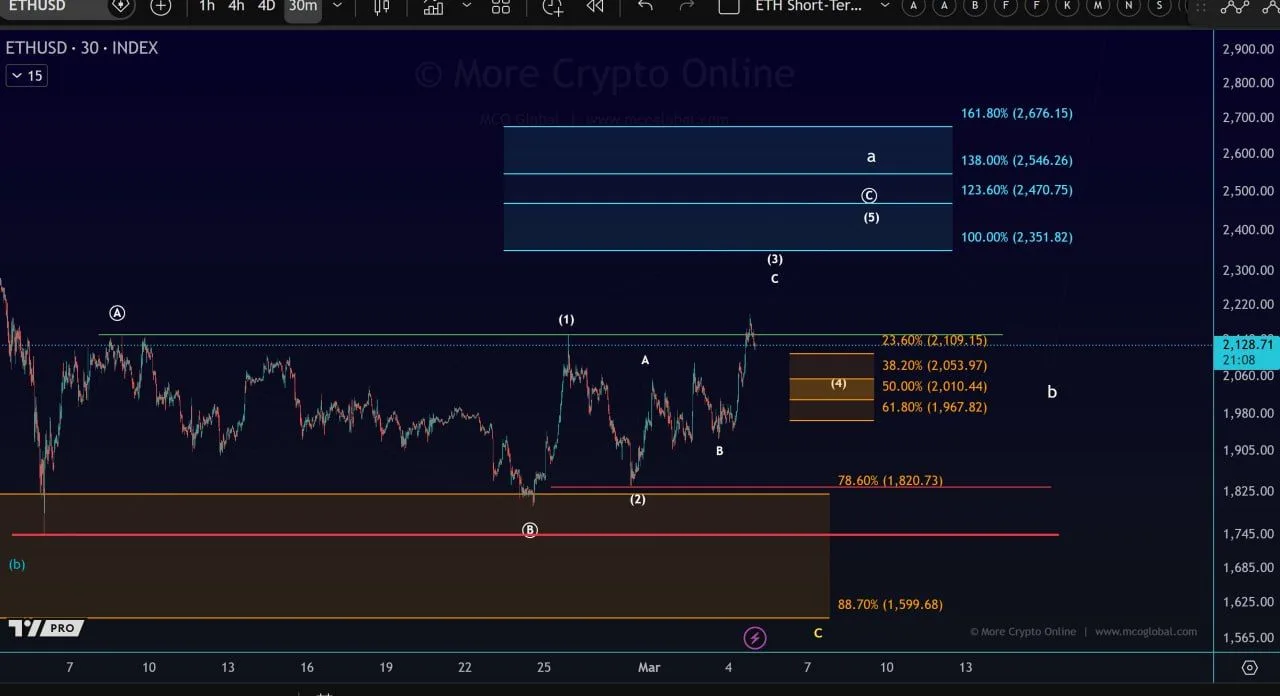
Ethereum Elliott Wave Structure. Source: More Crypto Online
The chart suggests $ETH could print one more high to complete wave c. It maps upside projections at 100 percent 2,351.82, 123.6 percent 2,470.75, 138 percent 2,546.26, and 161.8 percent 2,676.15.
After that, the same chart frames a likely wave (4) pullback zone using Fibonacci retracements at 23.6 percent 2,109.15, 38.2 percent 2,053.97, 50 percent 2,010.44, and 61.8 percent 1,967.82.
It also marks deeper downside reference levels at 78.6 percent 1,820.73 and 88.7 percent 1,599.68, shown as larger support bands if the correction extends.