


 7
7
Ethereum trades below major EMAs as opposing liquidation clusters near $1,950 and $2,100 signal rising volatility risk.
Ethereum ($ETH) is trading near $1,936, down over 3% on the day after sliding from the $1,990 area and struggling to regain the $1,960–$1,980 zone. The pullback reflects persistent intraday selling pressure, with price hovering in the low $1,930s as resistance continues to cap upside attempts. Derivatives activity remains dominant, with $50.39 billion in 24-hour futures volume compared to $3.47 billion in spot volume, underscoring heavy speculative participation.
Across different timeframes, performance remains under strain. $ETH is down 3.40% over 24 hours and 28.39% over 30 days, with deeper losses of 30.90% over 90 days and 55.26% over 180 days. Year-to-date, the asset has declined 34.78%. Notably, there is a risk of volatility if downside pressure continues. Can Ethereum price stabilize?
Can Ethereum Stabilize?
Ethereum remains under clear bearish pressure, trading well below its 50-day EMA at $2,311 and 100-day EMA at $2,659. The downward slope of the moving averages proves that the bearish structure is still intact.
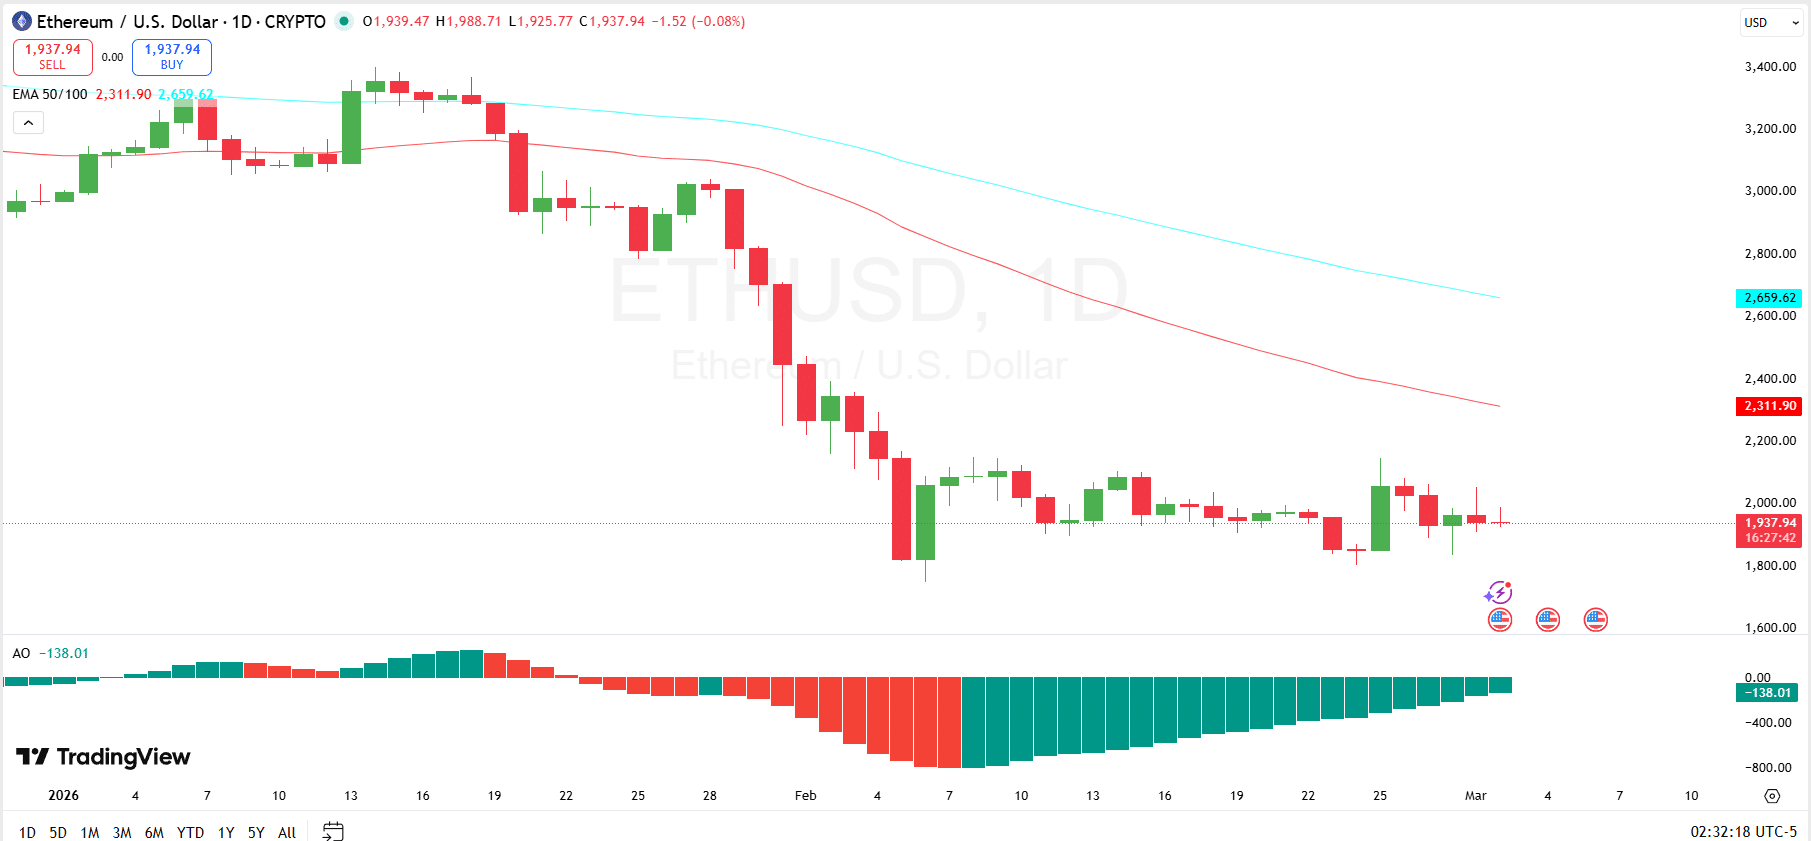
The price is currently hovering around the $1,937 region after a consistent decline, suggesting that $ETH is attempting to build a short-term base near the $1,900–$2,000 zone. However, until Ethereum reclaims the 50-day EMA and establishes it as support, the broader trend structure remains technically weak.
Momentum indicators show early signs of stabilization but not a confirmed reversal. The Awesome Oscillator remains in negative territory at approximately -138, reflecting ongoing bearish momentum. However, the histogram bars are deeply green, almost flipping to the positive region.
If this improvement in momentum continues alongside higher lows in price, Ethereum could attempt a recovery toward the $2,300 region. Otherwise, failure to hold the current range may expose the asset to another test of recent swing lows.
Here Are $ETH’s Key Liquidity Zones
Meanwhile, Ethereum’s liquidation heatmap shows two prominent short-term liquidity clusters that could act as magnets for price. According to analyst Ted, a significant short liquidation zone is building around the $2,100 level to the upside.

This area features dense bands on the heatmap, indicating a concentration of leveraged short positions that could be forced to close if the price pushes higher. A move into this region could trigger a short squeeze, accelerating upside momentum as positions face liquidation.
On the downside, a notable long liquidation cluster sits near the $1,950 level. This suggests a pocket of leveraged long positions that may be vulnerable if Ethereum dips lower. If price gravitates toward this zone, cascading long liquidations could intensify selling pressure in the short term.


