


 8
8
Ethereum bounced back after a sharp dip, shifting trader focus to nearby resistance levels. Analysts on X pointed to $2,100 and a $2,125 sell wall as the next major tests for the rebound.
Ethereum Rebounds Toward $2,000 as Traders Eye $2,100 Reclaim
Ethereum traded near the $2,000 level after recovering from a sharp selloff, with market commentator Ted Pillows saying the token had “fully recovered from yesterday's dump.” On the daily Binance chart shared on X, $ETH rebounded from a recent low near the mid $1,800 range and climbed back toward the $2,000 mark. The move erased most of the prior session’s losses and brought price back into a key horizontal zone that previously acted as support and resistance.
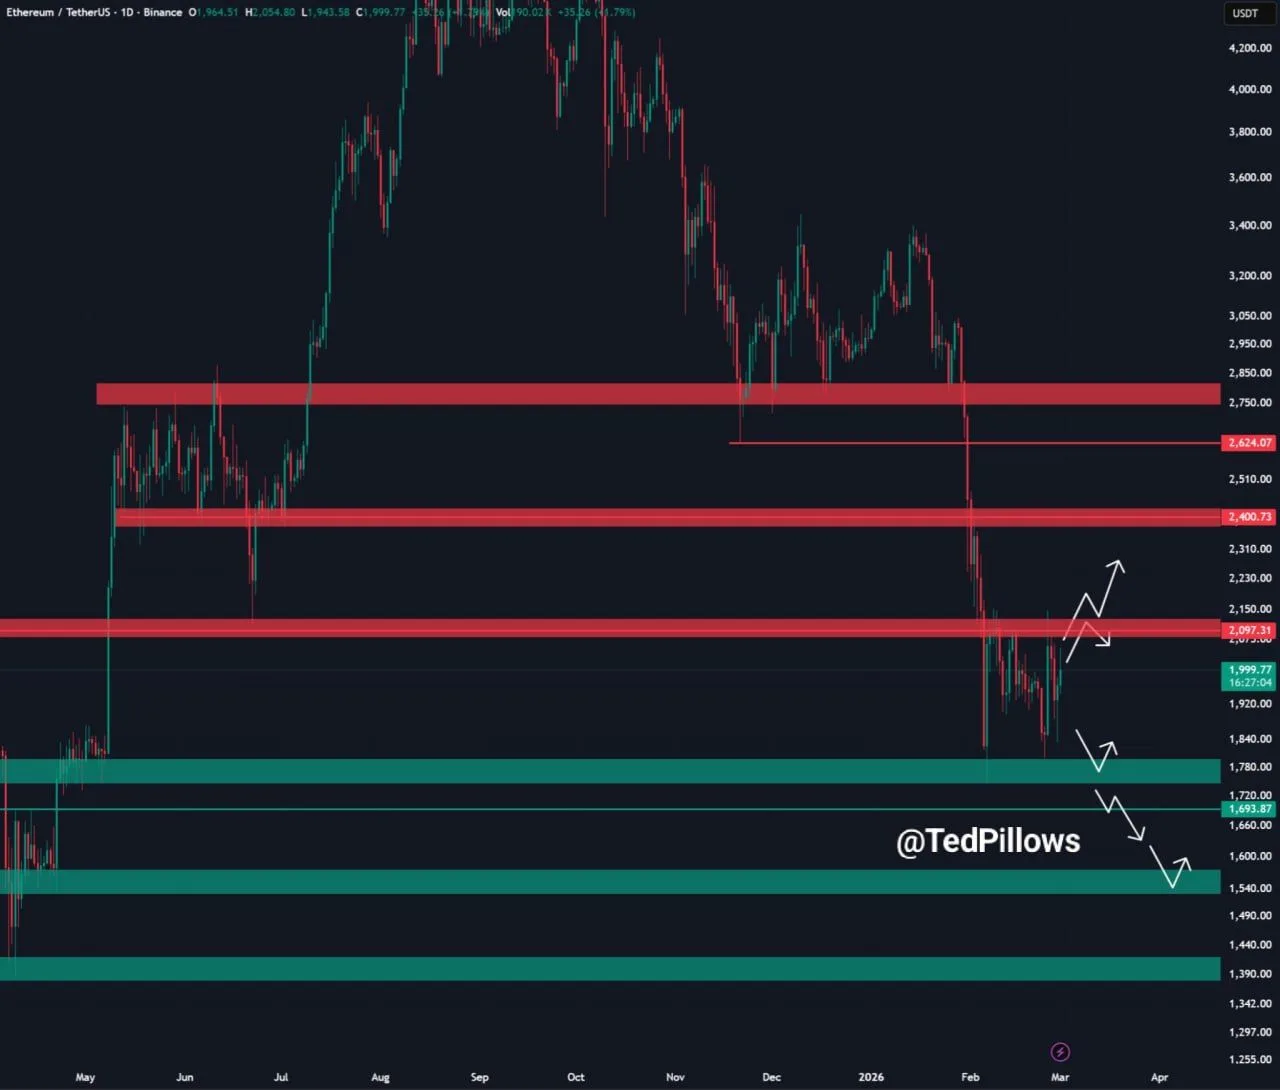
Ethereum/TetherUS Daily Chart. Source: Ted Pillows on X (@TedPillows)
The chart highlights $2,100 as the next level traders are watching. According to Ted, Ethereum needs to reclaim that area to strengthen the short term structure. The $2,100 zone aligns with a red resistance band on the chart, while $2,400 stands above as the next major supply area. Earlier breakdowns show $ETH losing the $2,400 region before accelerating lower, which turned that level into overhead resistance.
At the same time, the chart outlines lower support bands near $1,720 and $1,540. These areas marked prior demand during past consolidations. For now, Ethereum holds above the upper green support zone, while testing the lower edge of the $2,100 resistance region. A sustained move above that barrier could open the path toward $2,400, while failure to reclaim it would keep price inside the broader consolidation range.
Ethereum Faces $2,125 Sell Wall as Traders Watch for Breakout
Ethereum is approaching a sell wall near $2,125, a level that market commentator CW8900 said could act as resistance. In a post on X, he stated that $ETH will soon reach the $2,125 zone, describing it as a barrier that sellers may defend. The four hour Binance chart shared by the analyst shows a red resistance block positioned just above recent swing highs.
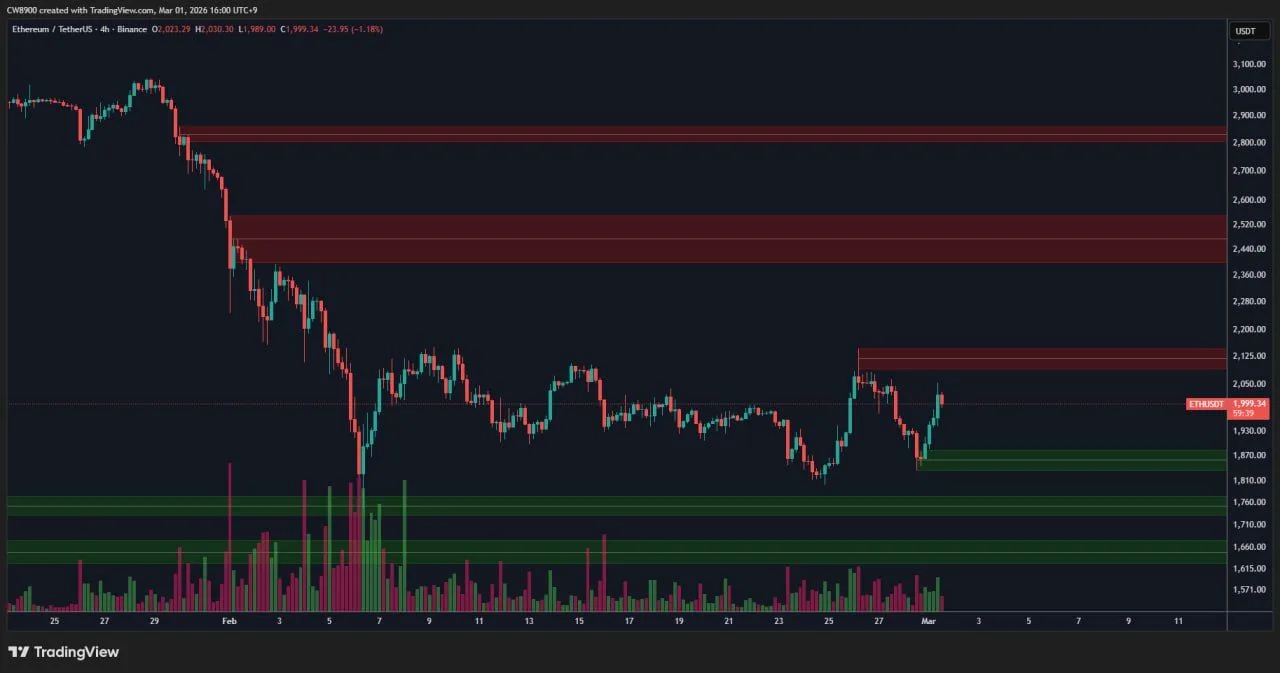
Ethereum/TetherUS 4 Hour Chart. Source: CW8900 on X (@CW8900)
The chart outlines a broader downtrend from late January, followed by a period of consolidation. After a sharp drop, Ethereum formed a base and then staged a rebound toward the highlighted resistance area. The $2,125 zone aligns with prior breakdown levels, where price previously failed to sustain upward momentum.
According to CW8900, a breakout above $2,125 is essential for further upward movement. If buyers push through that resistance and hold above it, the next supply region sits higher near the mid $2,400 area. However, if the sell wall holds, Ethereum could face renewed pressure and remain inside the broader range marked by lower support zones.

