


 7
7
Ethereum trades near critical support after months of steady selling pressure. The 4-hour chart shows a firm downtrend with lower highs and lower lows. Price rejected the 0.786 Fibonacci level near $3,047 and never regained strength.
Consequently, sellers tightened control after $ETH lost the 0.618 level at $2,768. That breakdown accelerated the slide toward $1,742, which now stands as major structural support.
Technical Structure Remains Bearish Below $2,050
$ETH recently bounced from $1,742 but remains below key resistance clusters. The $1,900 to $1,850 zone now acts as immediate short-term demand.
However, failure to hold this area increases the risk of another retest of $1,742. A clean break below that level could expose $1,650 and possibly $1,600.
On the upside, $2,036 to $2,050 forms the first resistance band. Additionally, $2,134 marks minor Fibonacci resistance near the 0.236 retracement.
If recovery builds, $2,377 at the 0.382 level becomes the next barrier. Moreover, $2,572 at the 0.5 retracement represents a major trend shift zone.
Related: Bitcoin Price Prediction: BTC Open Interest Drops as Bears Hold Control
The Ichimoku cloud remains overhead and flat, reinforcing consolidation within a broader bearish structure. DMI indicators show selling pressure cooling. However, buyers still lack decisive momentum.
Derivatives Reset Signals Cautious Positioning
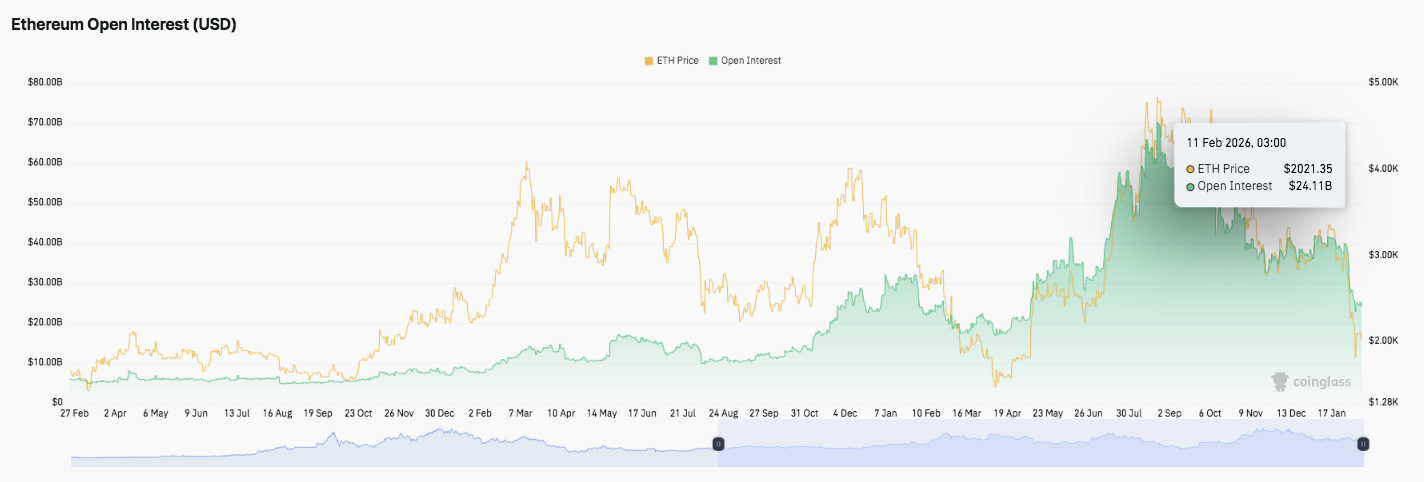
Ethereum open interest expanded aggressively through mid-year and peaked near $60 billion. That surge reflected rising leverage and strong speculative appetite. Significantly, recent data shows open interest contracting toward $24 billion. This unwind suggests liquidations, position trimming, and reduced leverage exposure.
Spot flow data also highlights persistent distribution trends. Red netflow bars dominated large stretches from mid-year into early winter. Several heavy outflow spikes aligned with price pullbacks, signaling exchange deposits. Besides that, occasional green spikes suggest selective accumulation at local bottoms.
Related: LayerZero (ZRO) Price Prediction: Can LayerZero Clear $2.46 and Extend Rally?
Recent netflows remain slightly negative, with fresh outflows near $47 million. Hence, traders appear cautious around key technical levels.
Robinhood Expands Ethereum Utility With Layer-2 Testnet
The Robinhood Chain public testnet is live 🛠️
— Robinhood (@RobinhoodApp) February 11, 2026
Developers can now build on a financial-grade Ethereum Layer 2 built on @arbitrum— designed to support tokenized real-world and digital assets.
Start building with the core foundation of Robinhood Chain: https://t.co/yHCQRh5x3j…
Amid this backdrop, Robinhood launched a public testnet for its Ethereum-based layer-2 chain built on Arbitrum. The network aims to support tokenized stocks, ETFs, and other real-world assets. Additionally, developers can now build publicly ahead of a planned mainnet launch later this year.
Robinhood seeks to enable 24/7 trading and self-custody through its crypto wallet. Moreover, users can bridge assets across chains and access DeFi applications on Ethereum.
Ethereum’s base layer upgrades continue to improve capacity and reduce costs. Consequently, layer-2 networks increasingly focus on specialized applications rather than pure scaling. Robinhood’s move reflects this shift and underscores Ethereum’s evolving ecosystem.
Technical Outlook for Ethereum Price
Key levels remain clearly defined as Ethereum trades within a broader bearish structure. Price continues to respect the $1,742 swing low, which marks critical structural support.
Upside levels: $2,036–$2,050 serve as immediate resistance and align with the lower Ichimoku boundary. A break above $2,134 (0.236 Fib) would signal improving momentum. If bulls sustain strength, $ETH could extend toward $2,377 (0.382 Fib), followed by $2,572 (0.5 Fib), which marks a major trend shift level.
Downside levels: $1,900–$1,850 remains the first demand zone to defend. Below that, $1,742 stands as key structural support. A breakdown exposes $1,650 and potentially $1,600.
The technical picture shows Ethereum consolidating beneath the cloud after a sharp retracement from the $3,047 rejection zone. Momentum indicators reflect cooling selling pressure, yet bulls lack confirmation. The structure resembles a compression phase within a broader downtrend, where volatility could expand quickly in either direction.
Will Ethereum Rebound?
Ethereum’s near-term outlook depends on whether buyers defend $1,900 and reclaim $2,050 decisively. A sustained move above $2,134 would shift short-term sentiment and open the path toward $2,377. However, failure to hold $1,900 increases the probability of another sweep of $1,742.
For now, $ETH sits in a pivotal range. Derivatives positioning has cooled, and spot flows remain cautious. Consequently, confirmation through strong volume and inflows will determine whether Ethereum builds a recovery base or extends its corrective phase.
Related: Cardano Price Prediction: ADA Tests Multi-Month Lows as Open Interest Drops & Outflows Continue
Disclaimer: The information presented in this article is for informational and educational purposes only. The article does not constitute financial advice or advice of any kind. Coin Edition is not responsible for any losses incurred as a result of the utilization of content, products, or services mentioned. Readers are advised to exercise caution before taking any action related to the company.

