


 6
6
The Ethereum price is down more than 5% over the past few days and has now slipped below a key short-term structure. On February 10, $ETH fell under $1,980 after failing to hold a narrow rebound channel. This move followed a sharp decline in DeFi activity and weakening institutional flows. Yet, despite the pressure, large holders have started adding again.
The question is simple: is this early accumulation, or just a temporary pause before another leg lower?
Pattern Break Confirms Weak ‘Big Money’ Support
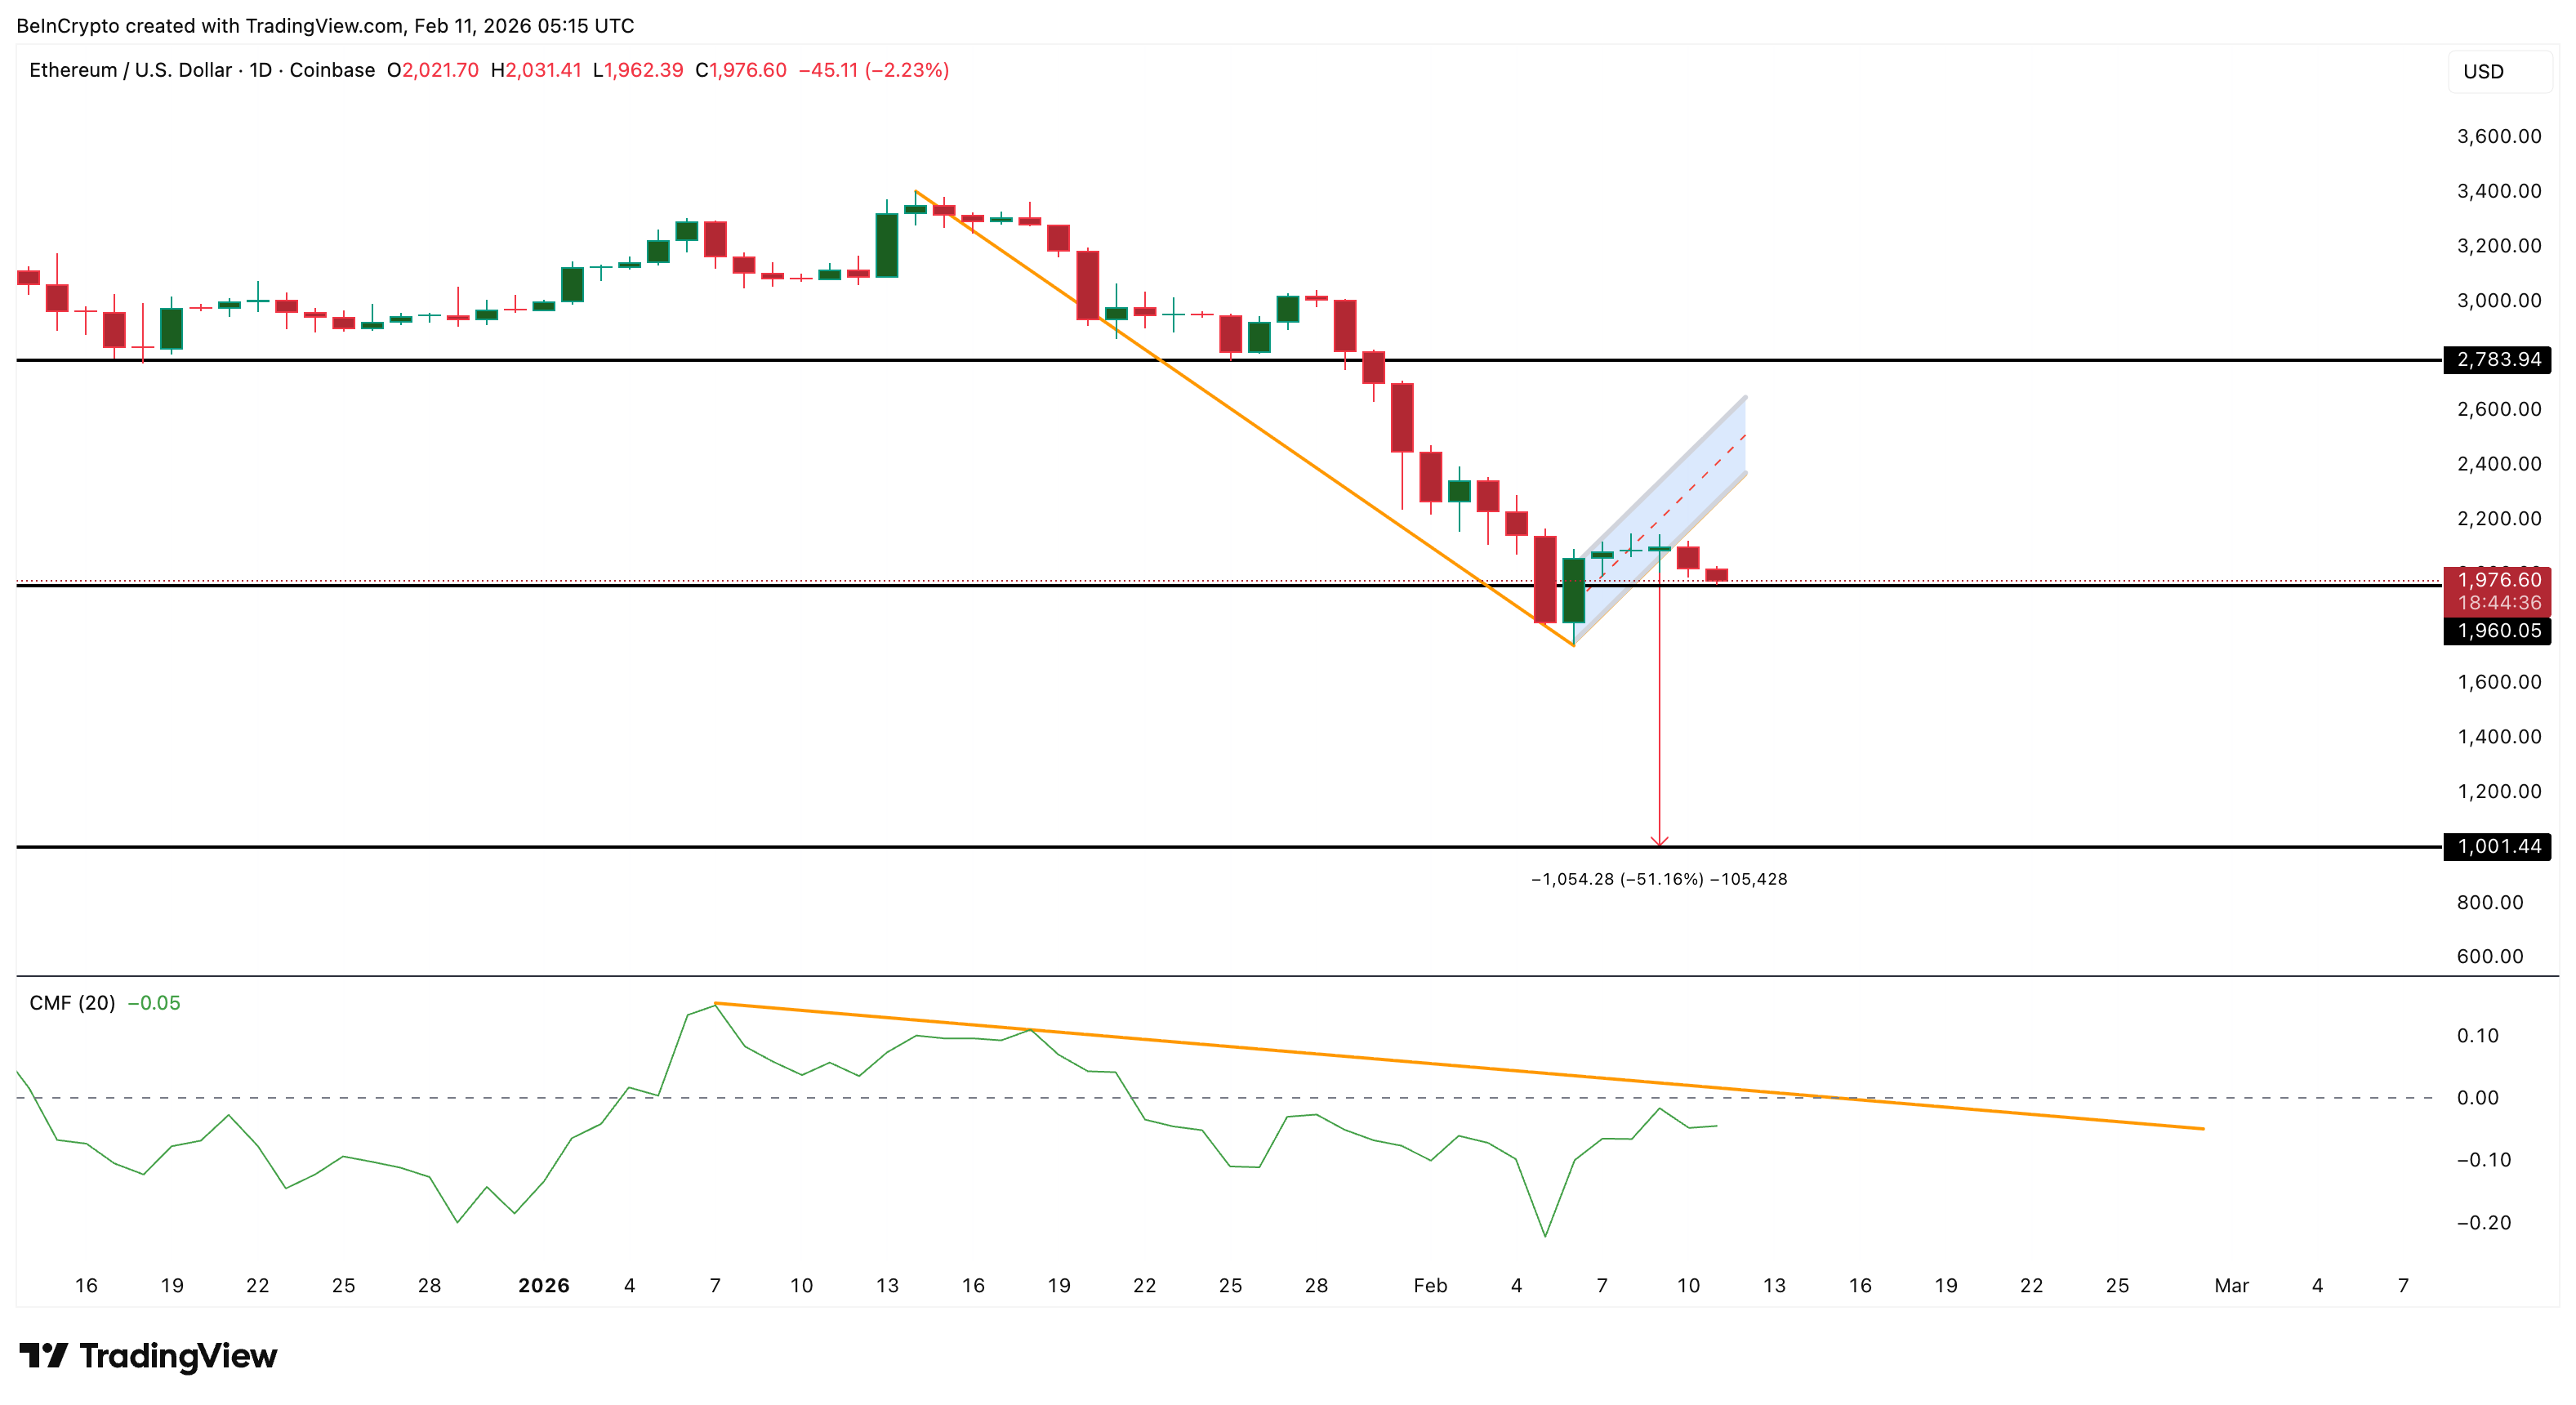
Ethereum’s recent rebound from early February formed inside a bear flag. This structure acted like a short-term recovery attempt, not a trend reversal. On February 10, the price slipped below the lower boundary of the flag, triggering a pattern break with over 50% crash potential, as predicted in a previous Ethereum analysis.
This move mattered because it happened alongside weak money flow.
The Chaikin Money Flow, or CMF, measures whether capital is entering or leaving an asset using price and volume. When CMF moves above zero, it often shows large-scale institutional-style buying. When it stays below, it signals weak participation.
Between February 6 and February 9, $ETH bounced, but CMF never crossed above zero. It also failed to break its descending trendline. This meant the rebound lacked strong backing from large investors.
Want more token insights like this? Sign up for Editor Harsh Notariya’s Daily Crypto Newsletter here.
In simple terms, the price moved up, but serious money did not follow strongly enough. When rebounds happen without strong CMF backing, they tend to fail. That is exactly what happened here. Once buying momentum stalled, sellers regained control and pushed $ETH lower.
This confirms that the pattern break was not random. It was possibly supported by fading big money flows. But technical weakness alone does not explain the full picture.
DeFi TVL and Exchange Flows Reveal a Structural Problem
A deeper issue sits inside Ethereum’s DeFi activity.
Total Value Locked, or TVL, measures how much money is stored inside decentralized finance platforms. It reflects real usage, capital commitment, and long-term confidence. When TVL rises, users are locking funds. When it falls, capital is leaving.
BeInCrypto analysts combined the TVL and exchange flow dashboards to show a clear pattern.
On November 13, DeFi TVL stood at $75.6 billion. At the same time, $ETH traded around $3,232. The exchange net position change was strongly negative, indicating more coins were leaving exchanges than entering. Investors were possibly moving $ETH into self-custody.
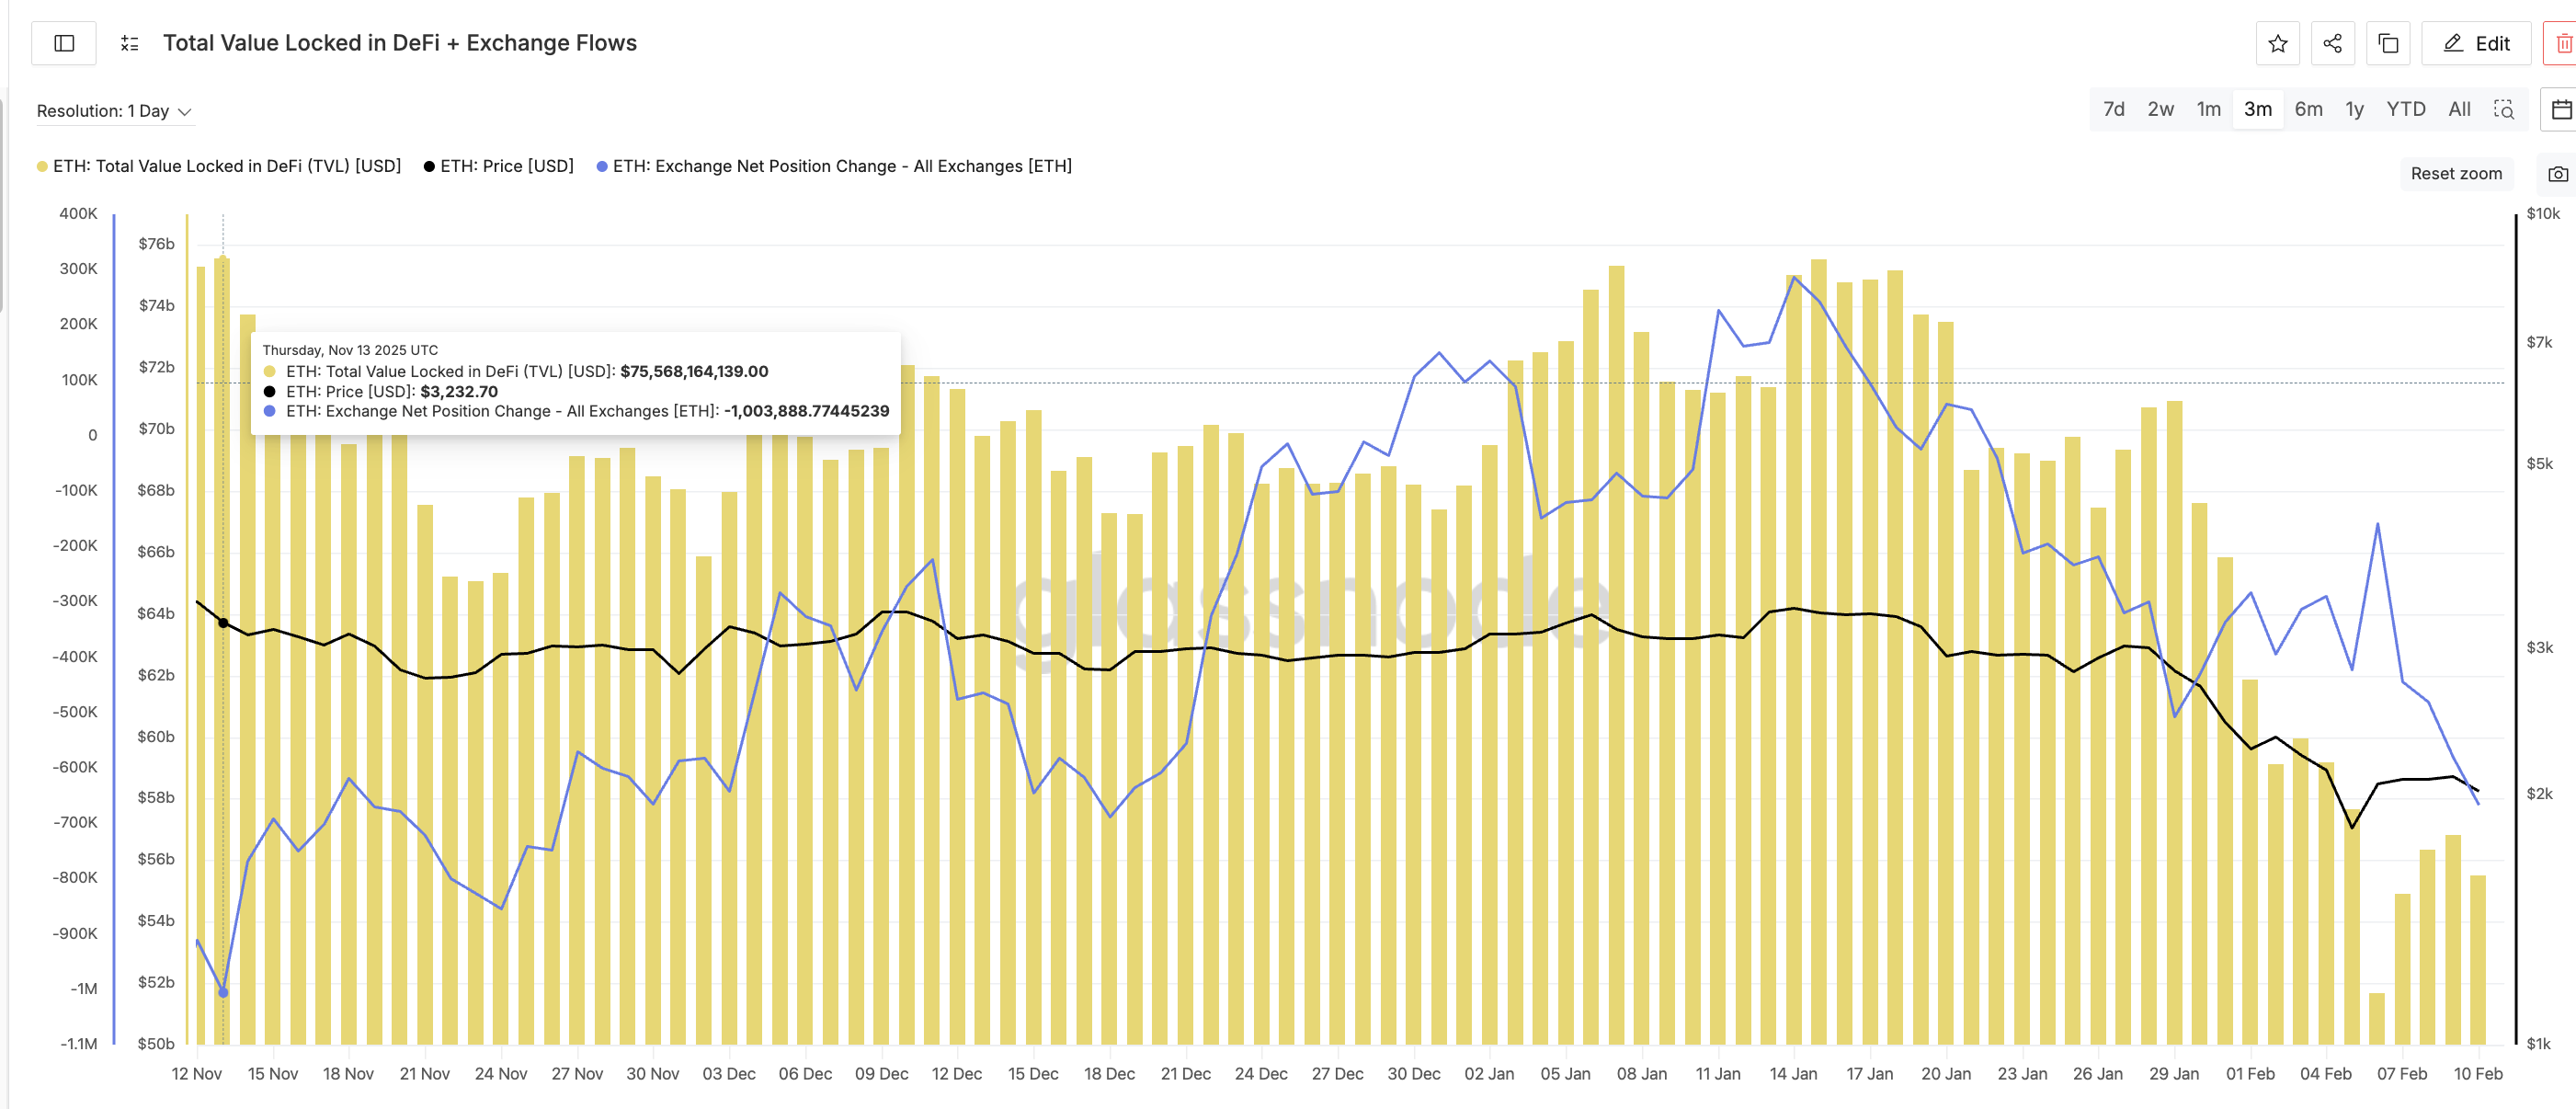
That was a healthy setup.
By December 31, TVL had dropped to about $67.4 billion. $ETH fell to $2,968. Exchange flows flipped positive. Around 1.5 million $ETH moved onto exchanges. Selling pressure increased. Now look at February.
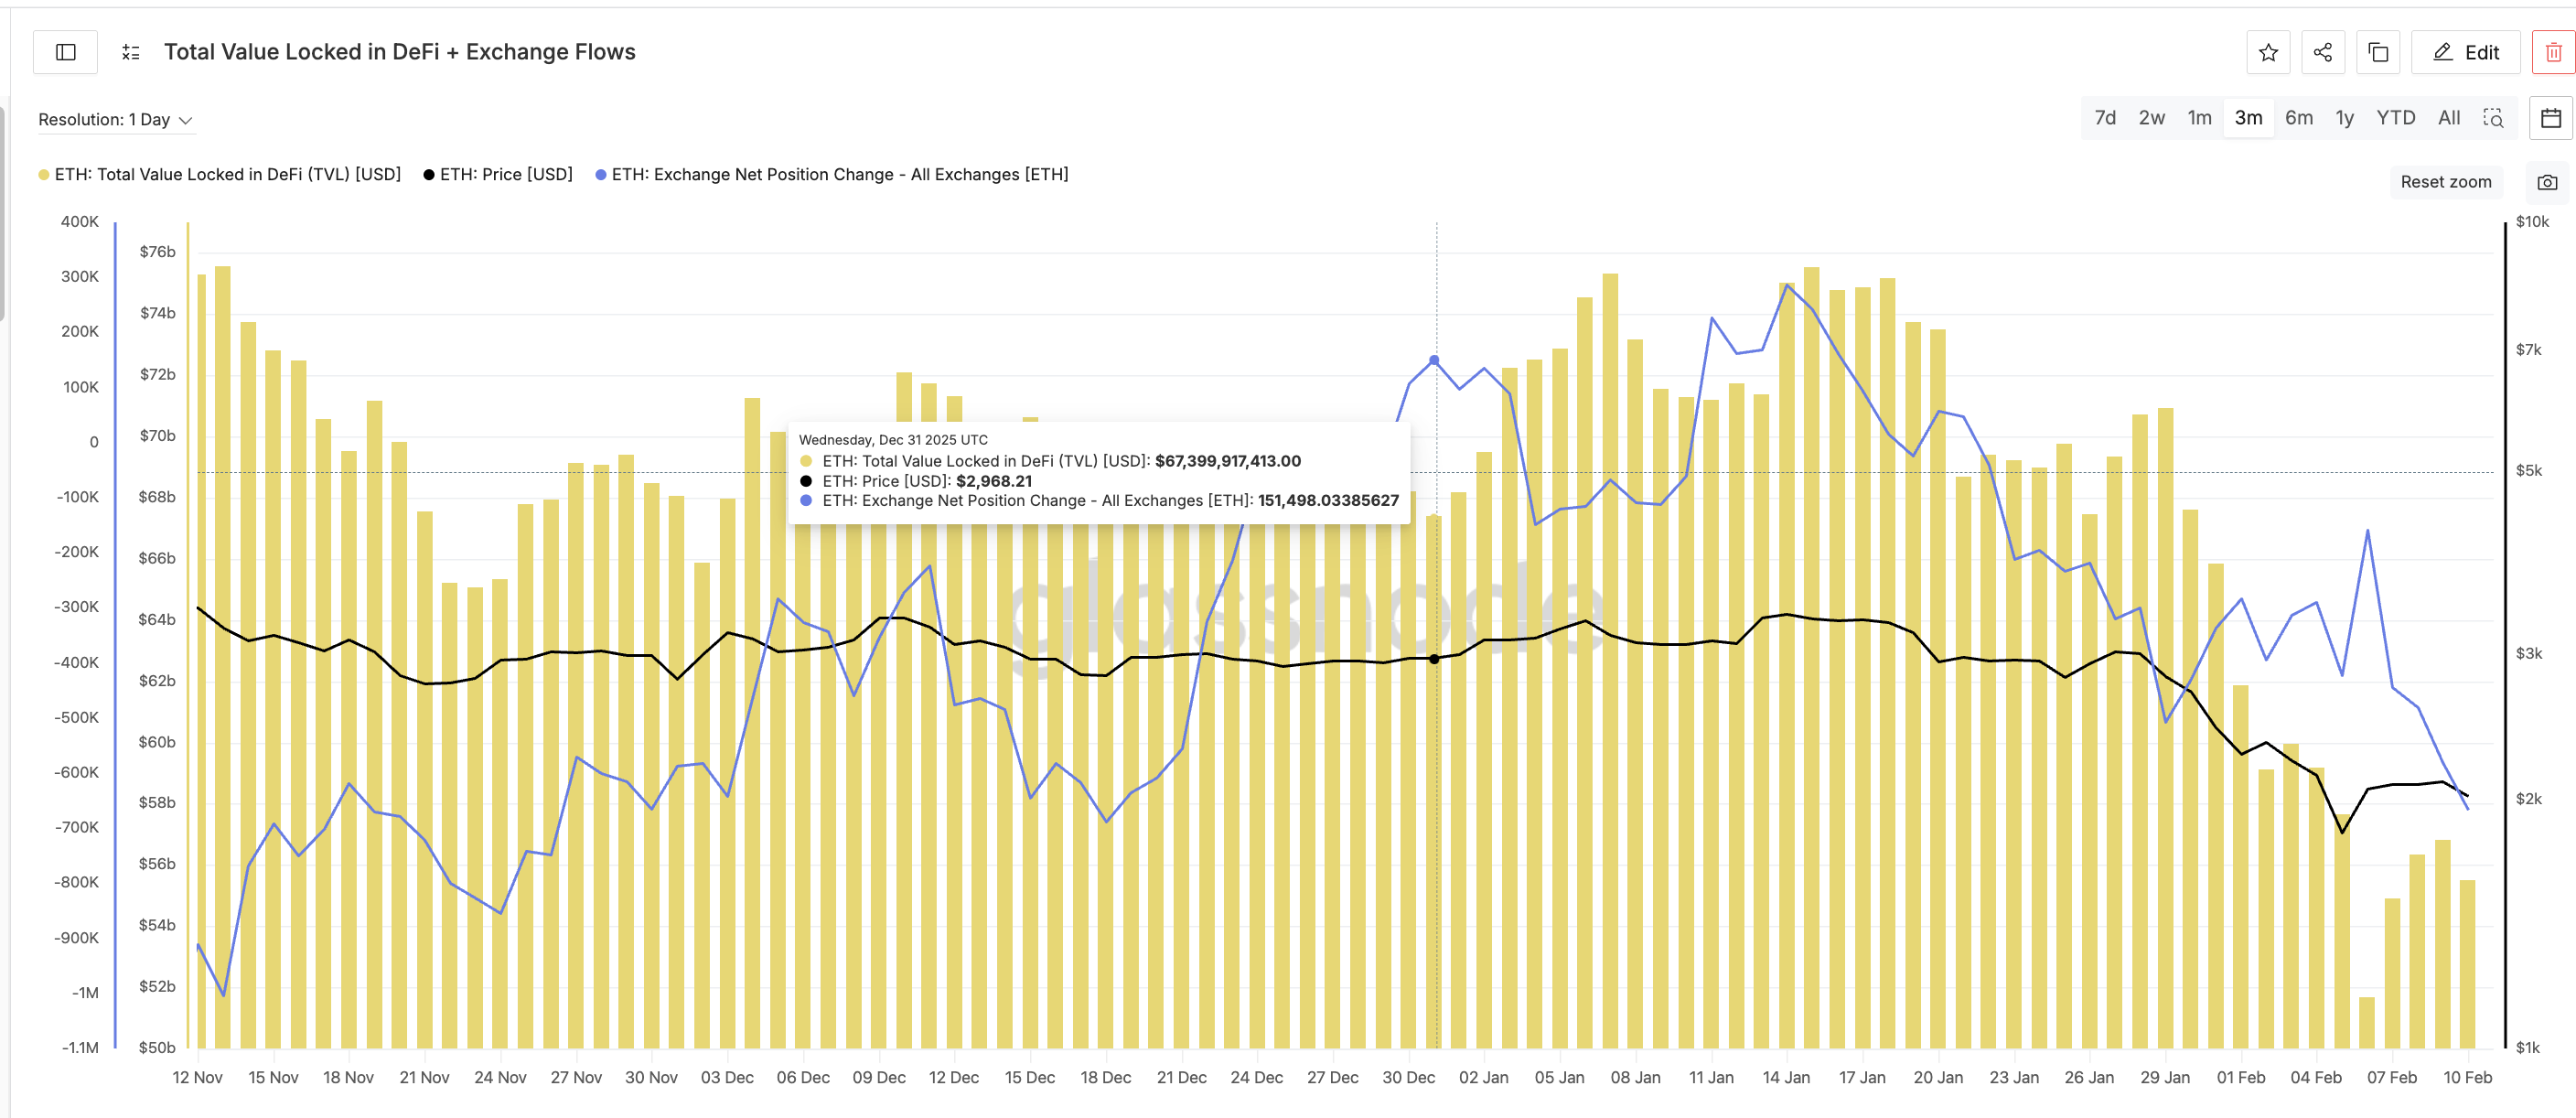
On February 6, DeFi TVL touched a three-month low of $51.7 billion. $ETH was near $2,060. Exchange outflows weakened sharply (the Net Position line reached a local peak). Even though net flows stayed slightly negative, buying pressure collapsed, as explained by the February 6 peak. This shows a repeating relationship.
When TVL falls, exchange inflows rise or outflows weaken. That means capital is shifting from long-term use toward potential selling.
As of February 10, TVL has only recovered to around $55.5 billion, down almost $20 billion from the mid-November levels. That is still close to the three-month low. Without a stronger recovery, exchange-side pressure is likely to return. So the pattern break is happening while Ethereum’s core usage remains weak.
That is a structural problem, not just a chart issue.
Whale Accumulation and Cost Basis Explain the Ethereum Price Support
Despite weak technicals and falling TVL, whales have not fully exited.
Whale supply tracks how much $ETH is held by large wallets, excluding exchanges. Since February 6, whale holdings fell from about 113.91 million $ETH to nearly 113.56 million. That confirmed the distribution during the breakdown. But over the past 24 hours, this trend paused.
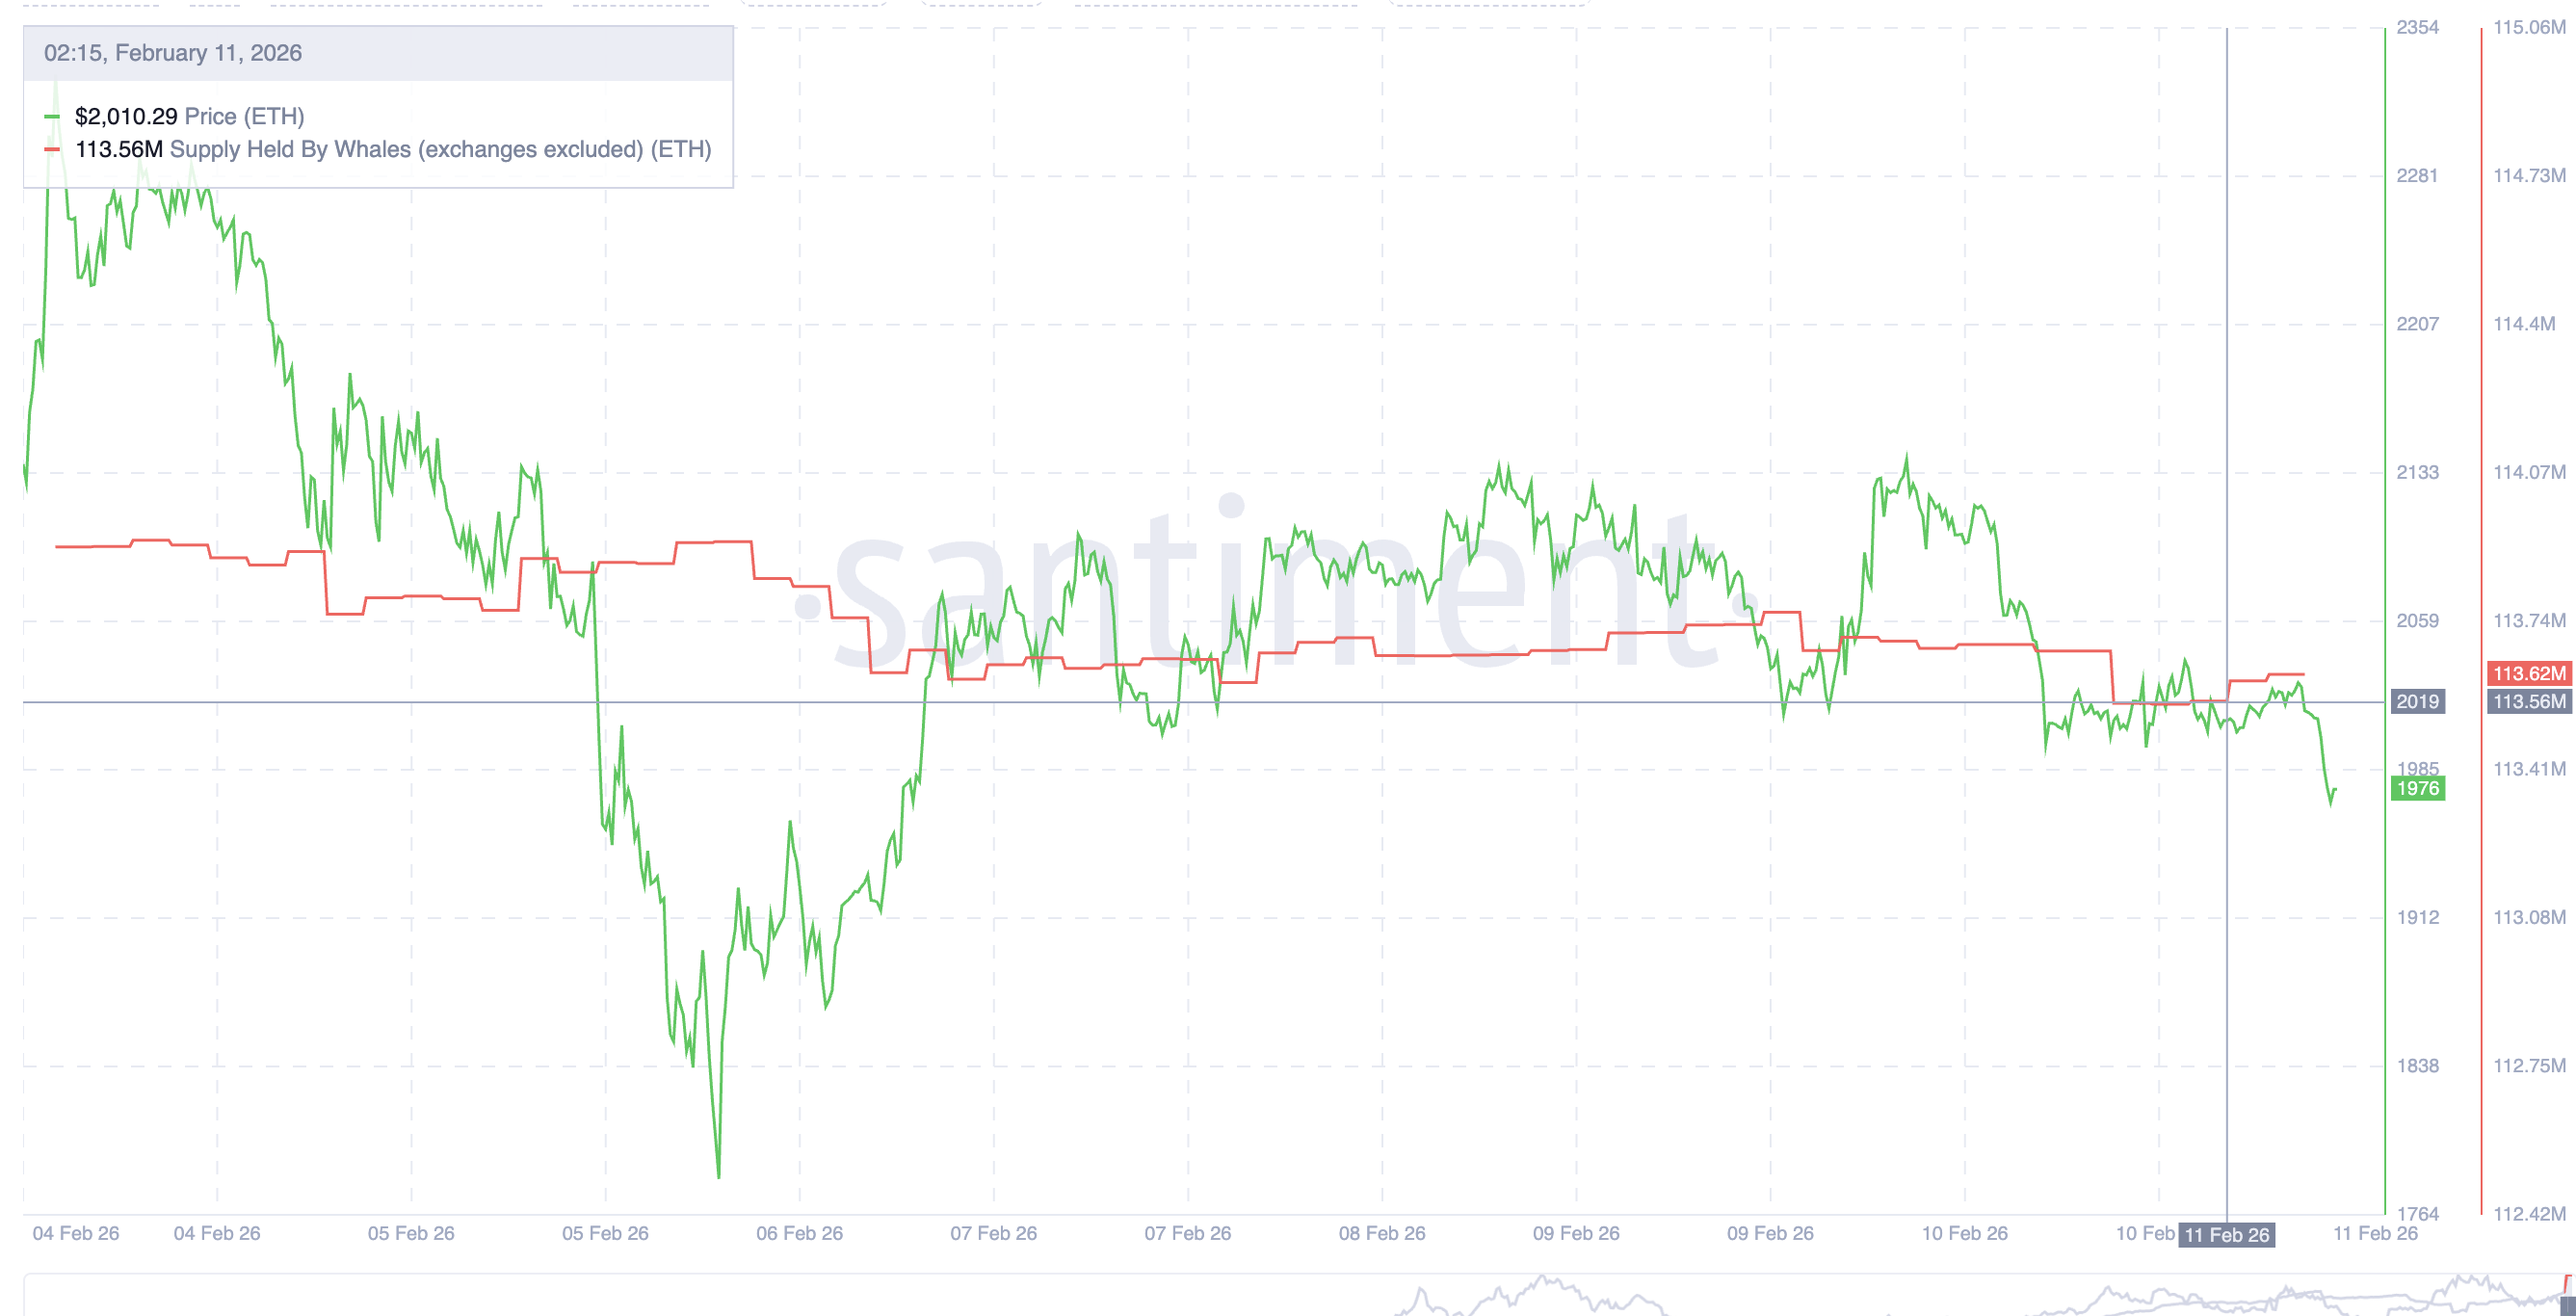
Holdings edged back up slightly, from 113.56 million $ETH to 113.62 million, showing small-scale accumulation. This suggests that whales are testing support rather than committing fully.
The reason becomes clear when looking at cost basis data.
Cost basis heat maps show where large groups of investors bought their coins. These zones often act as support because holders defend their entry prices. For Ethereum, a major cluster sits between $1,879 and $1,898. Around 1.36 million $ETH were accumulated in this range. That makes it a strong demand zone.
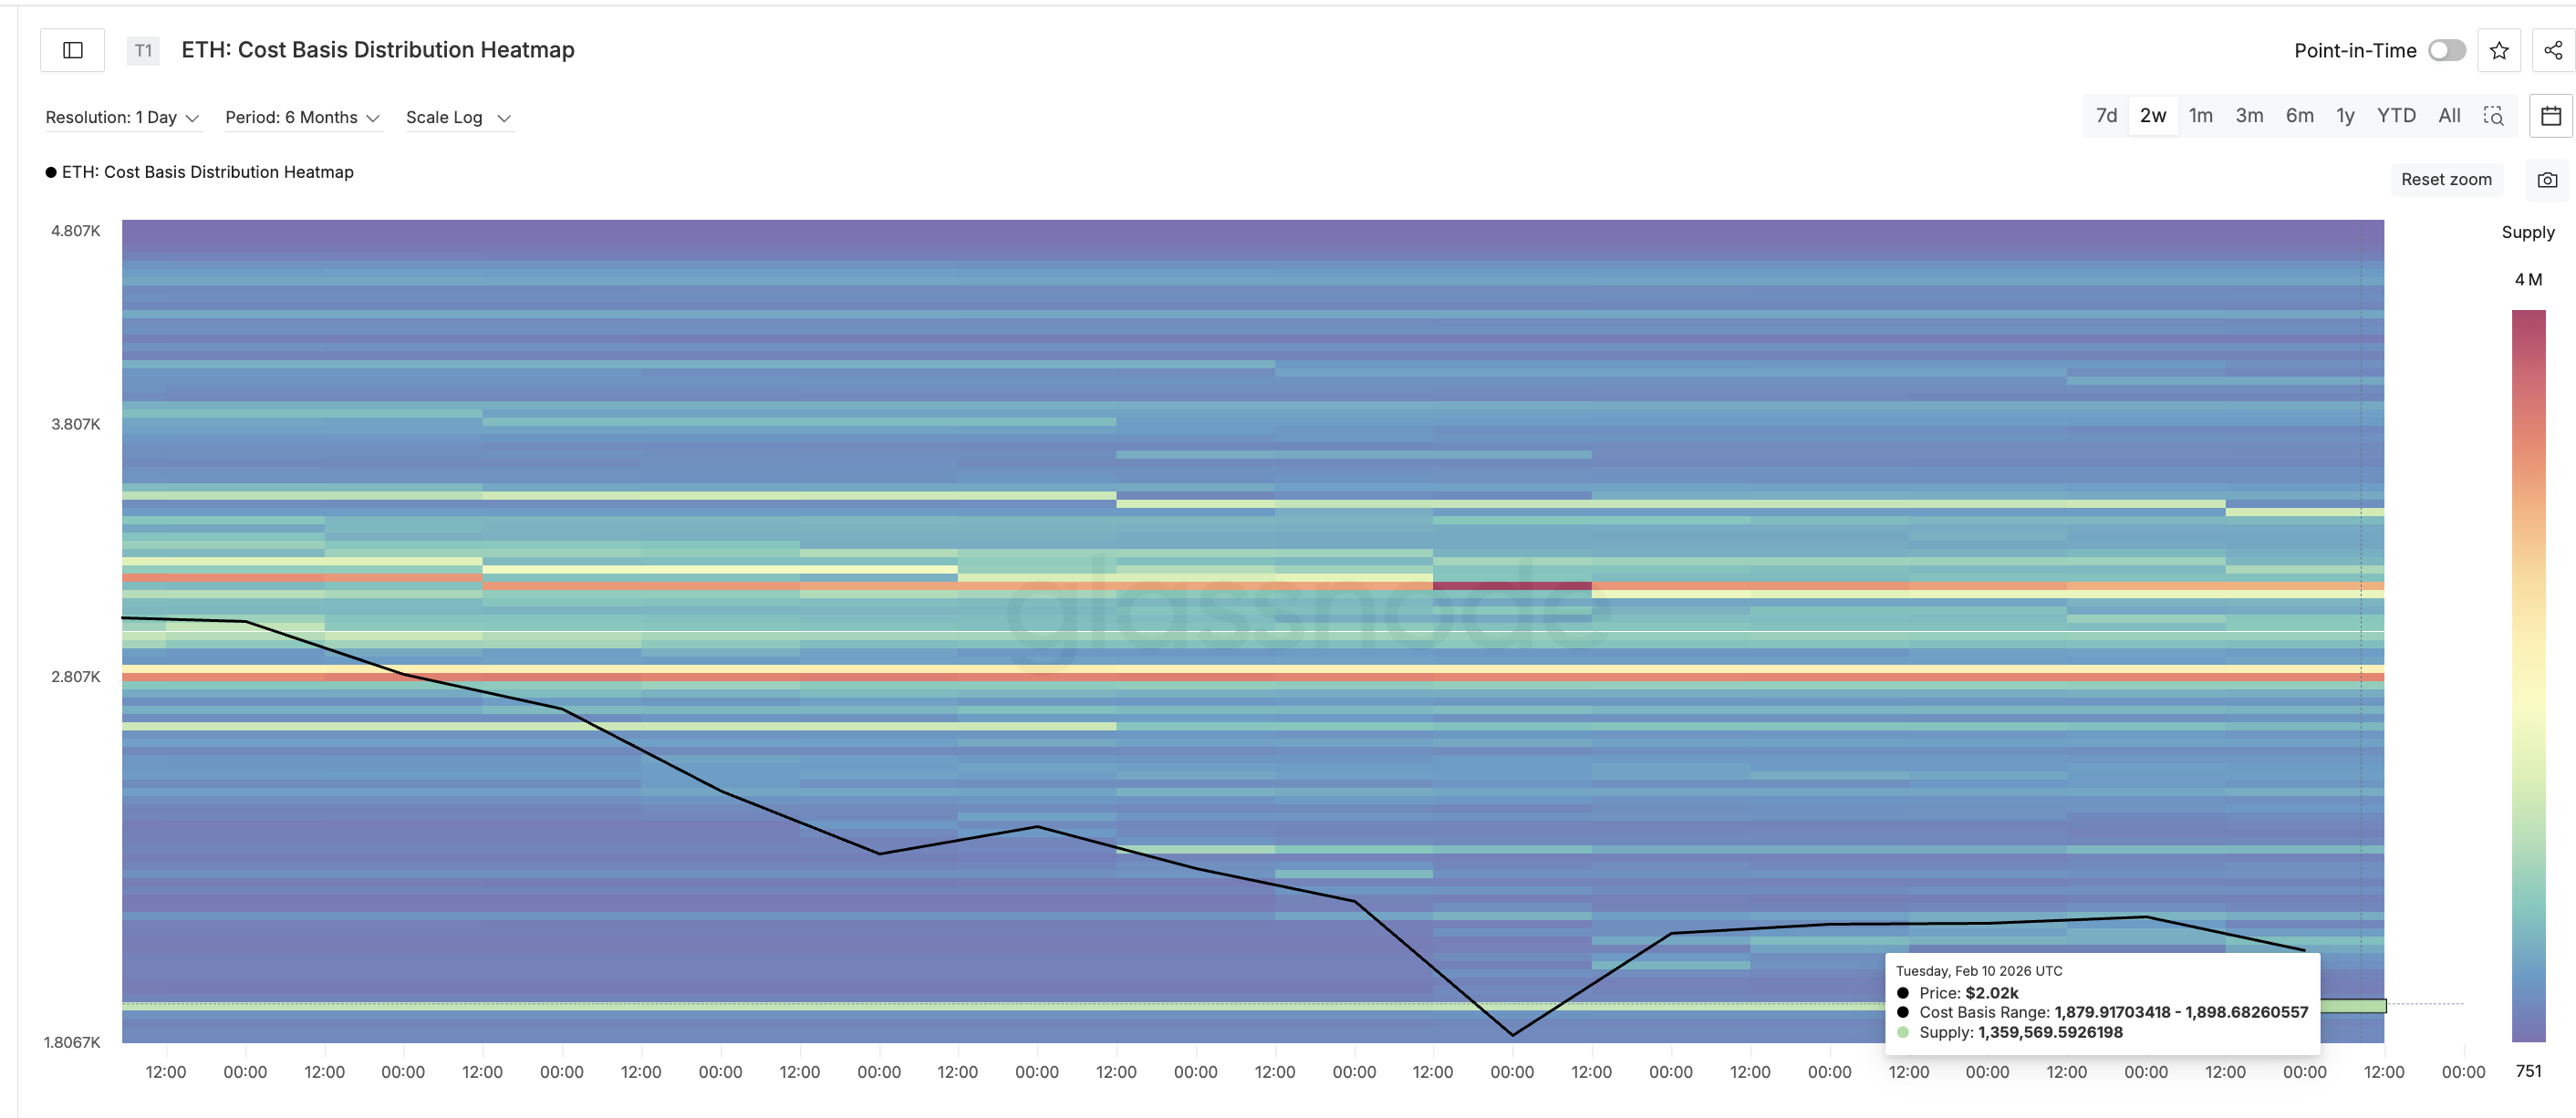
The current price is hovering just above this area.
As long as $ETH stays above this band, whales have an incentive to defend it. Falling below would push many holders into losses and likely trigger heavier selling. This explains the cautious buying.
Whales are not betting on a rally. They are possibly protecting a critical cost zone.
From here, the Ethereum price structure becomes clear.
Support sits near $1,960 and then $1,845. A daily close below $1,845 would break the main cost cluster and confirm deeper downside risk. If that happens, the next major downside zones sit near $1,650 and $1,500.
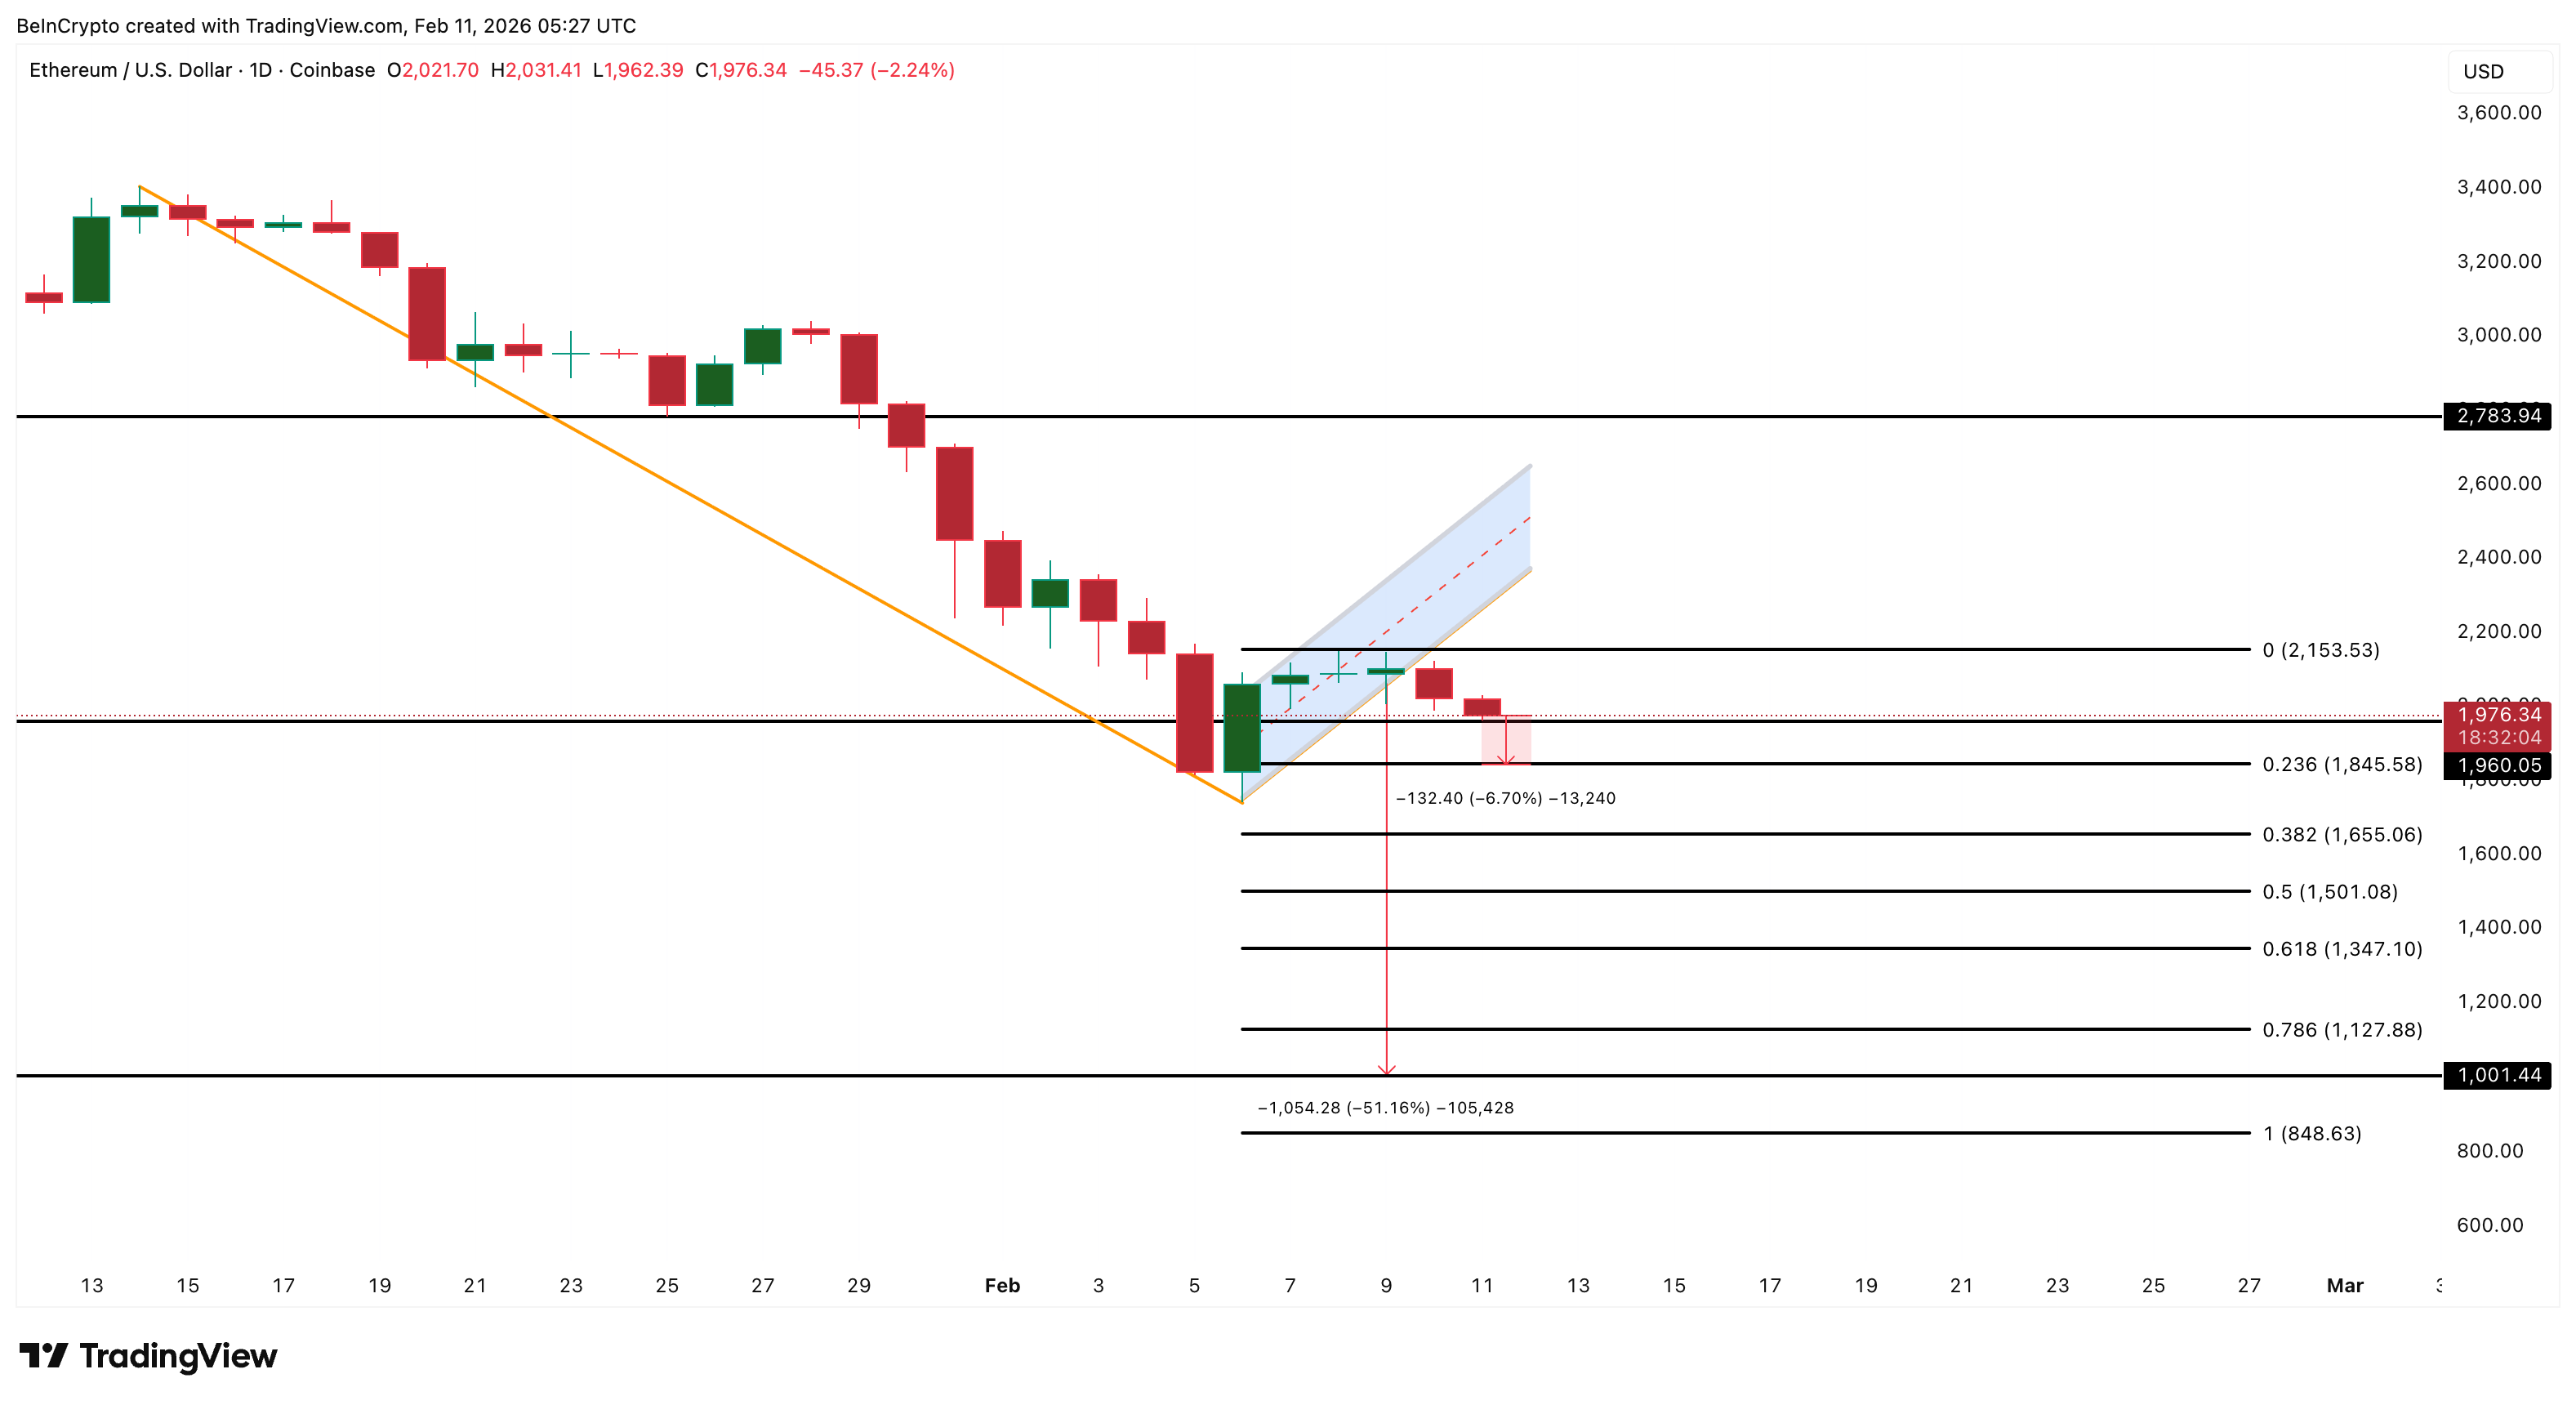
On the upside, $ETH must reclaim $2,150 to stabilize. Only above $2,780 would the broader bearish structure weaken. Until then, rebounds remain weak.
The post Ethereum ($ETH) Breaks Pattern Amid $20 Billion DeFi Slide — Why Are Whales Still Buying? appeared first on BeInCrypto.

