


 10
10
The cryptocurrency market is currently navigating a period of intense volatility as we move through early February 2026. After a weekend of attempted recovery, the "King of Crypto," $Bitcoin, has once again slipped below the critical psychological threshold of $70,000. Historically, such a move by Bitcoin acts as a gravity well for the broader market, and Ethereum ($ETH) is no exception.
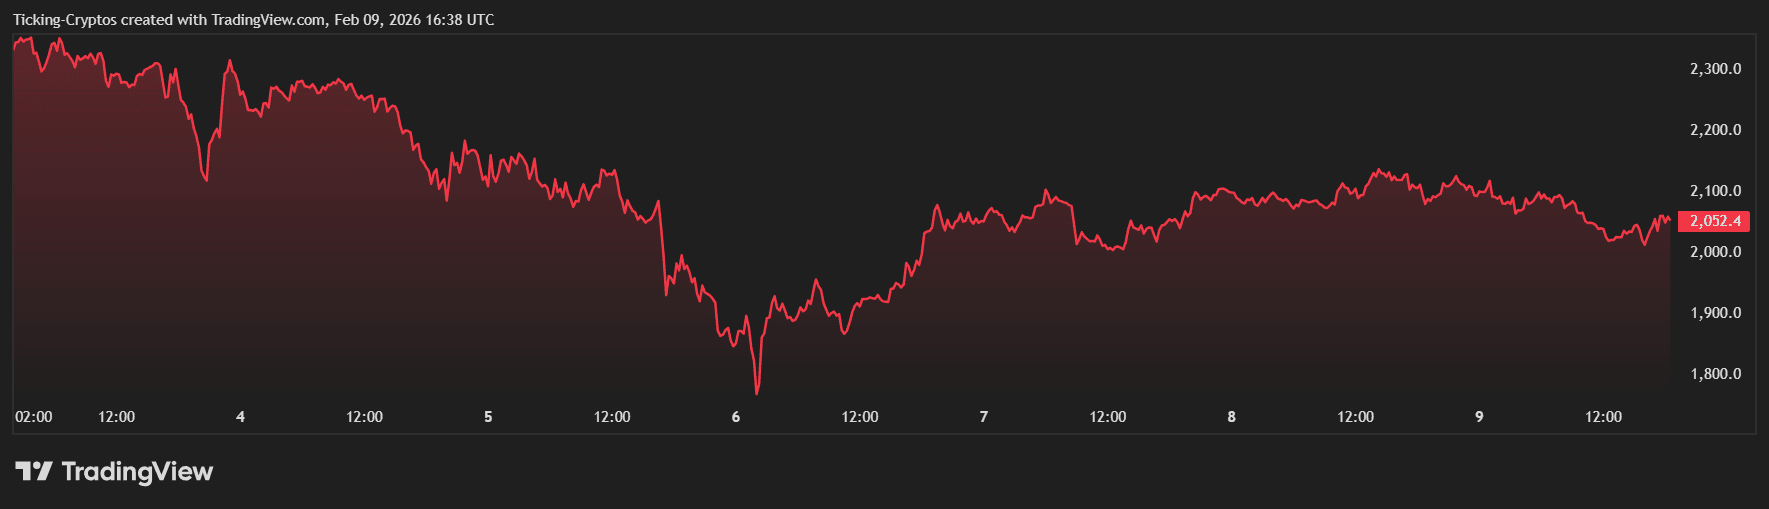
Currently, the $ETH coin price is hovering around $2,044, struggling to maintain its footing above the vital $2,000 level. With market sentiment shifting toward "Extreme Fear," traders are closely watching whether Ethereum will mirror Bitcoin’s weakness and plunge toward its deeper support zones.
Is Ethereum Price Set to Crash?
Recent data confirms a strong correlation between Bitcoin's failure to hold $70,000 and Ethereum's inability to sustain its recent gains. As Bitcoin trades near $69,500, Ethereum has already seen a 24-hour decline of approximately 2.65%. If the bearish momentum continues, a break below the $2,000 psychological level is highly probable, potentially triggering a cascade toward the $1,950 and $1,880 targets.
Ethereum Price Prediction: Psychological Levels and Support Zones
In trading, a psychological level is a price point ending in round numbers (like $2,000 or $70,000) that acts as a mental barrier for investors. A support zone is a price area where a downtrend tends to pause due to a concentration of buying demand.
- $2,000: The immediate psychological floor for $ETH.
- $1,950: The first technical support line.
- $1,880: A secondary, stronger support level.
- $1,810: The "last line of defense" before a deeper bearish cycle.
The Bitcoin Influence: Why $70,000 Matters
Bitcoin remains the primary liquidity driver for the entire crypto ecosystem. When Bitcoin loses a major level like $70,000, it often signals a "risk-off" environment where institutional and retail investors de-risk their portfolios.
On February 9, 2026, Bitcoin's decline was exacerbated by a recovery in gold prices, which climbed back above $5,000, drawing capital away from "digital gold." This shift has left altcoins, including Ethereum, vulnerable to sharp corrections.
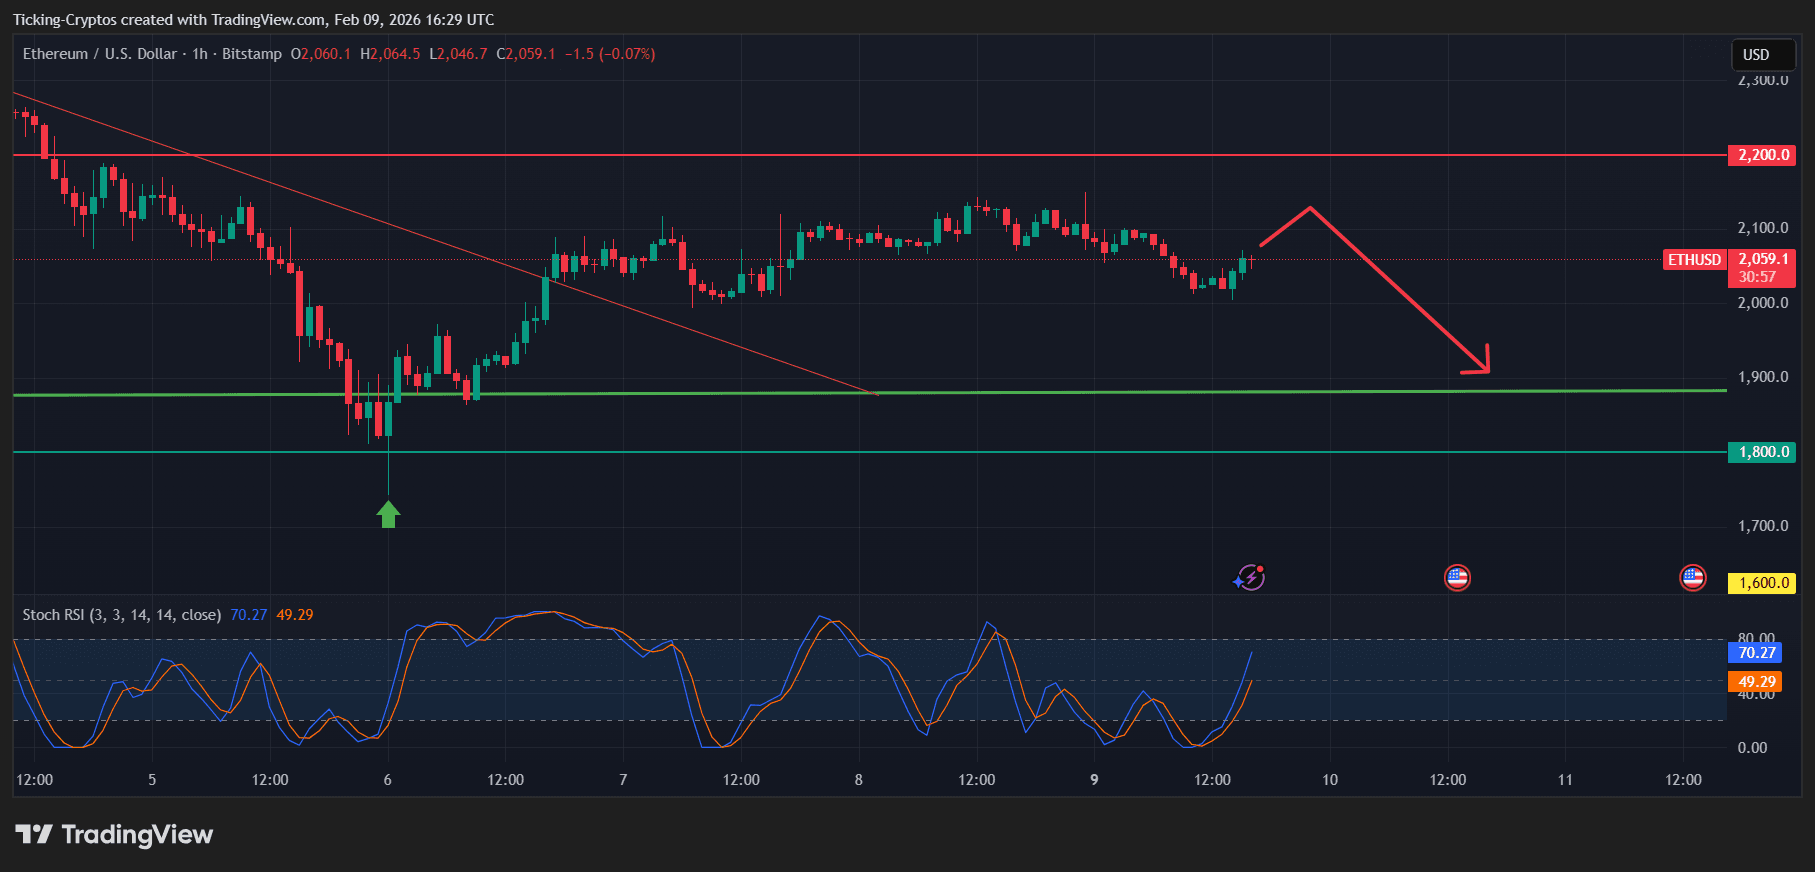
$ETH Coin Analysis: Analyzing the Ethereum Chart
Looking at the current $ETH/USD structure, we see a clear bearish divergence. Despite the sharp rebound last Friday that saw $ETH jump back from lows near $2,000, the lack of follow-through volume on Monday suggests that the "bulls" are exhausted.
Key Support Levels to Watch
If Ethereum fails to hold $2,000, the following levels become the primary targets:
- $1,950 Support: This is the immediate target for short-sellers. A 4-hour candle close below this could accelerate the sell-off.
- $1,880 Support: This level aligns with previous consolidation zones from late 2025. It represents a significant area where "dip buyers" might step in.
- $1,810 Support: If the macro environment remains hostile, a drop to $1,810 would represent a total retracement of the recent mini-rally, confirming a medium-term bearish trend.
Note: The "Fear & Greed Index" currently sits at a chilling 9, indicating "Extreme Fear." While this often precedes a bottom, the immediate trend remains firmly to the downside.
Will Ethereum Crash Further?
Ethereum is currently at a crossroads. The loss of Bitcoin’s $70,000 support has created a bearish ripple effect that threatens to push $ETH below $2,000. If the support at $1,950 fails, the path toward $1,880 and even $1,810 becomes a reality. Traders should remain cautious and use stop-loss orders to protect capital in this "Extreme Fear" environment.
