


 20
20
Ethereum extended its pullback as sellers held control, with key support and resistance zones in focus.
Notably, Ethereum ($ETH) has traded lower over the past 24 hours, falling about 2.9% to roughly $2,858. This came after spending much of the day drifting near the $2,787–$2,943 area. The intraday structure shows a clear “step-down” sequence, followed by a rebound that recovered part of the losses and lifted price back toward the mid-$2,800s.
The pullback also came as precious metals such as gold and silver have been surging, drawing fresh attention to traditional risk hedges in the current macro backdrop.
The performance table reinforces a softer broader tone, with $ETH down about 11% over 7 days and around 9.3% over 14 days. This implies the latest dip fits within a wider corrective phase unless price can reclaim and hold above the $2,900+ area.
Where’s Ethereum Headed?
On the daily $ETH/USD chart, Ethereum last traded around $2,864, showing buyers defended the $2,780–$2,810 area after a deeper pullback. The recent candle sequence reflects a clear downswing from the low-to-mid $3,000s into the high $2,000s, with momentum still tilted bearish in the near term.
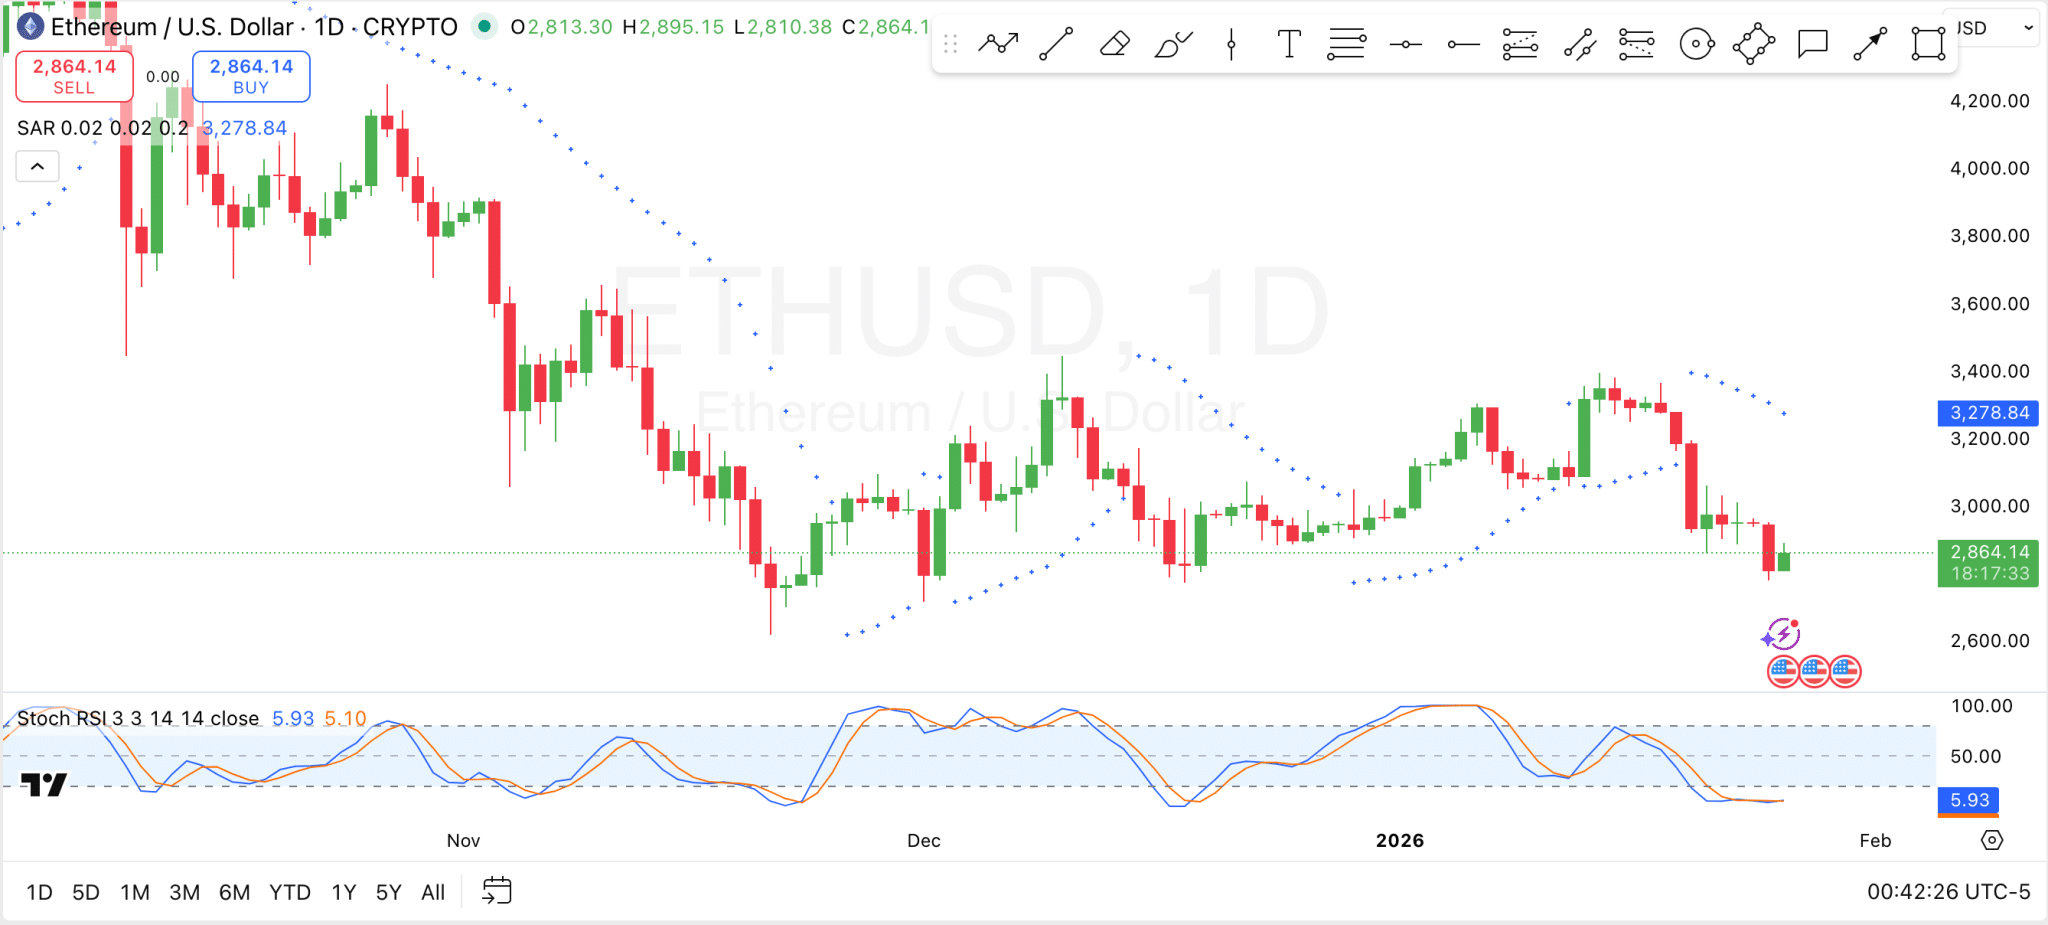
From a structure perspective, $2,800 is the immediate support to watch; a clean break below it would expose the next psychological zone around $2,600, while rebounds will likely face friction around $3,000 first.
Further, the Parabolic SAR currently sits above price (around $3,278 on the chart), which typically signals that the prevailing trend remains down until the price can reclaim that level and the Parabolic SAR dots flip back underneath the daily candles, signaling a potential shift toward a more constructive uptrend.
Meanwhile, the Stoch RSI is extremely depressed, keeping $ETH in oversold territory. This combination often precedes short-term relief bounces, but it does not confirm a trend reversal on its own; for the downside pressure to ease materially, the chart would need to show stronger follow-through above $3,000 and, ideally, a SAR flip. Otherwise, rallies may continue to acrt as corrective moves within a broader pullback.
Ethereum Liquidation
Ethereum’s liquidation data shows a clear long-side wipeout over the broader window, consistent with a market that has been leaning bullish into a downside move. Over 24 hours, total liquidations were about $220.33M, with longs accounting for roughly $203.53M versus $16.80M in shorts.
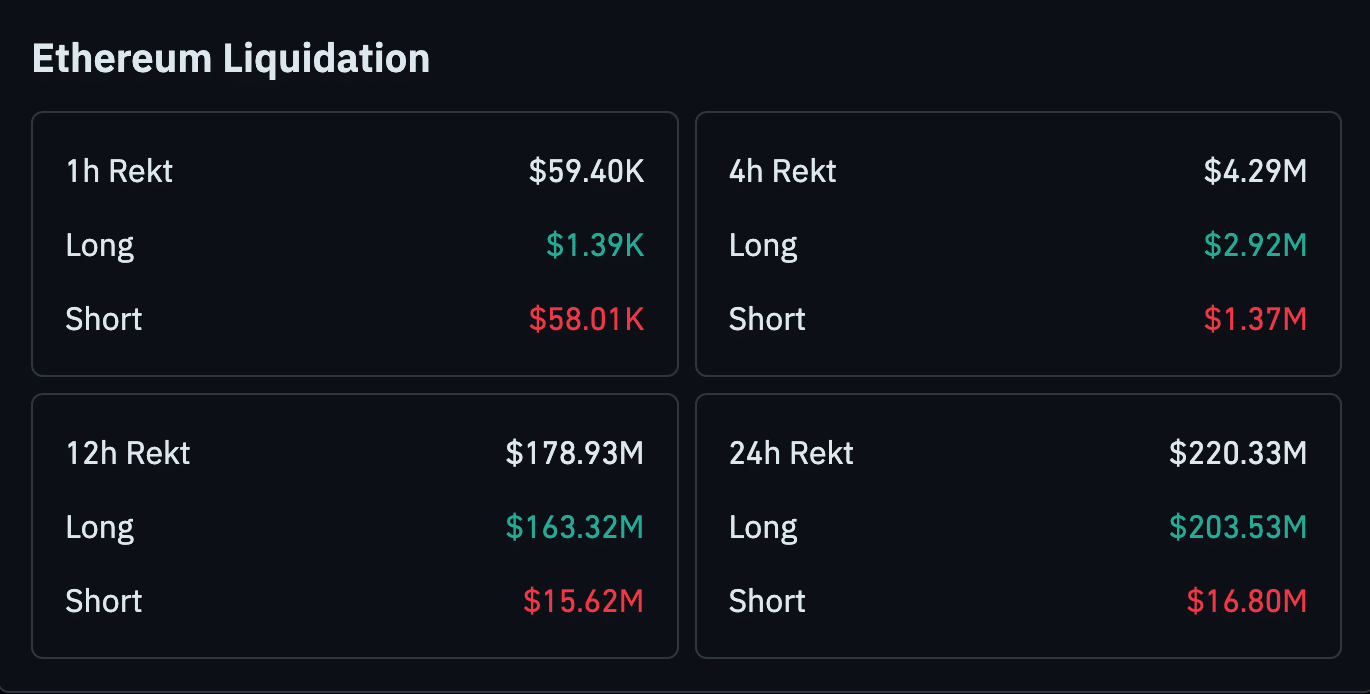
The same imbalance appears over 12 hours ($178.93M total; $163.32M longs vs $15.62M shorts), indicating that the bulk of forced deleveraging came from long positions.
Shorter timeframes look more mixed and help explain the intraday chop. Specifically, in the last 4 hours, liquidations totaled around $4.29M, still long-heavy ($2.92M longs vs $1.37M shorts).
However, the 1-hour snapshot flips, with a small short liquidation skew (~$58.01K shorts vs ~$1.39K longs; $59.40K total).

