


 17
17
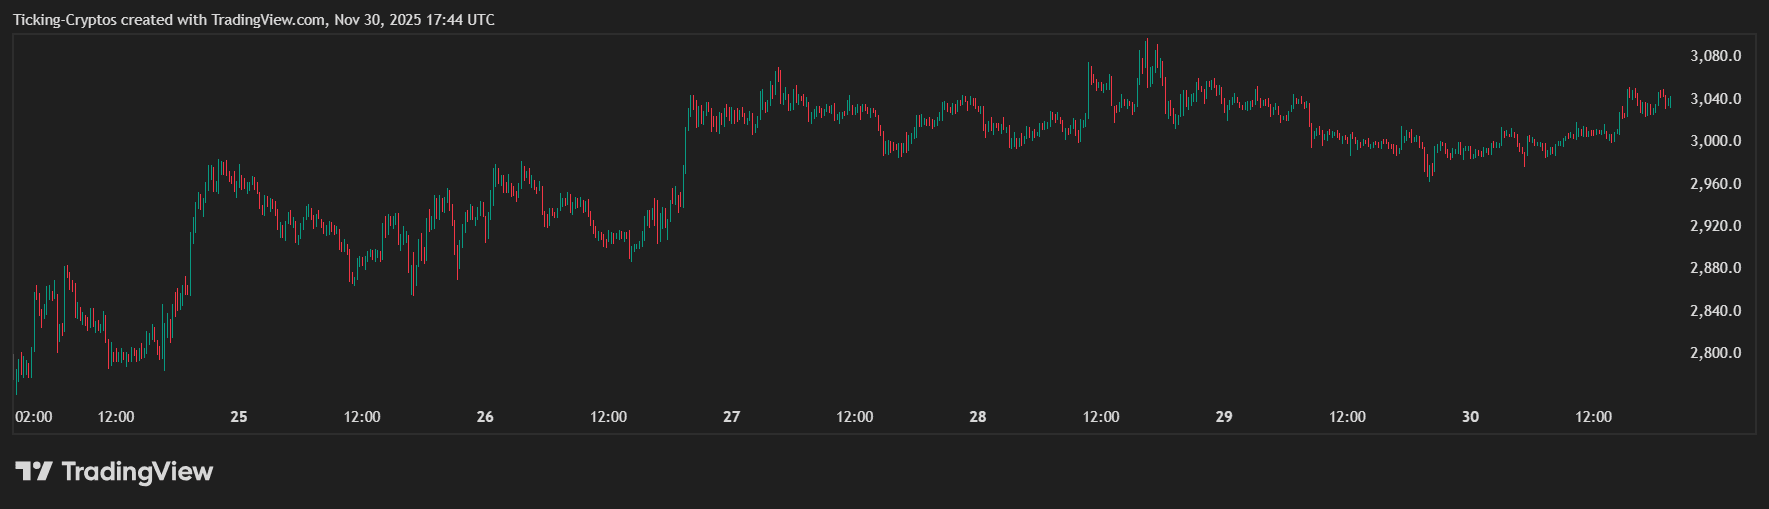
$Ethereum is trading around $3,030, regaining the key $3,000 psychological level after a decisive rebound from support. Renewed ETF inflows, rising whale accumulation, and improving technical momentum all contributed to the bounce. With $ETH now consolidating just below major resistance, traders are watching whether it can trigger a breakout toward higher levels.
Below is the full breakdown of why $ETH is up — and where the price could go next based on the chart.
Why Ethereum Price Is Up
1. ETF Demand Returns (Bullish Impact)
Overview
After facing $1.4B in net outflows through November, Ethereum ETFs flipped positive with $368M in inflows during the final week. This shift aligned with reduced geopolitical tension and $ETH’s prolonged underperformance compared to Bitcoin.
What This Means
Institutions appear to be rotating back into $ETH, treating it as a catch-up play. ETF inflows decrease sell pressure and act as confirmation that the $3,000 support area is fundamentally backed by institutional demand.
Watch For
Whether inflows continue into early December
If $ETH ETF demand outpaces BTC for the first time in weeks
2. Whale & Derivatives Activity (Mixed Impact)
Overview
On-chain data shows whales added 14,618 $ETH (~$185M) in late November. At the same time, $ETH derivatives open interest rose $700M, with longs dominating shorts 2:1 near $2,960.
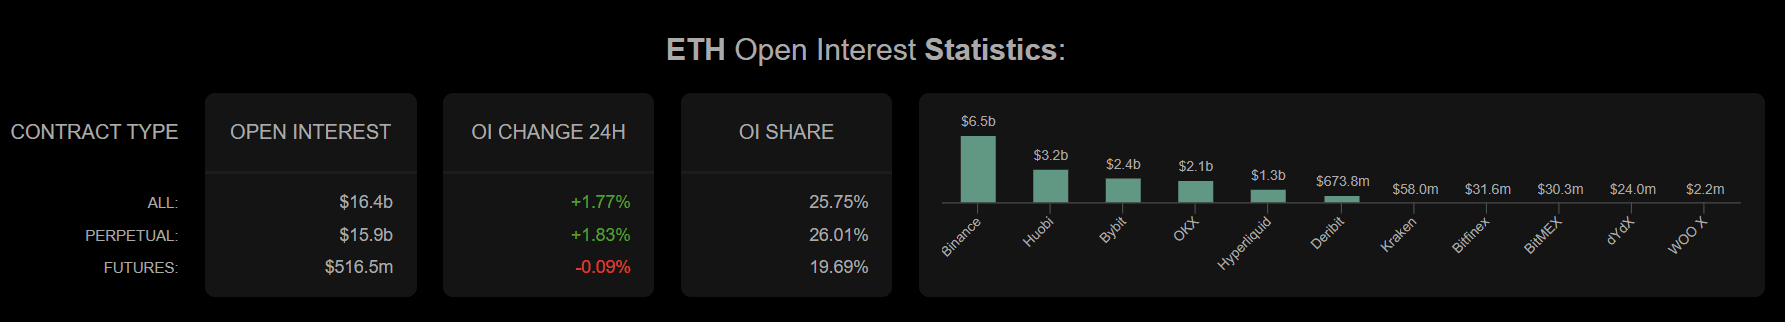
What This Means
Large players are aggressively defending the $2,960–$3,000 zone. However, rising leverage — 3.97M open contracts — introduces liquidation risks if $ETH fails to break above $3,100 resistance.
Watch For
Long liquidations if $ETH rejects at $3,100–$3,200
Leverage resets that could trigger either volatility spike
3. Technical Momentum (Bullish Short-Term)
Overview
$ETH has reclaimed the 20-day EMA ($2,968) and printed a bullish MACD crossover with a strong histogram at +37.73. The zone between $2,960 and $3,000 now acts as confirmed support.
What This Means
If $ETH maintains a daily close above $3,000, traders expect continuation toward key Fibonacci levels, especially the 38.2% retracement at $3,270. However, the 200-day MA at $3,520 remains a major resistance barrier.
Ethereum Chart Analysis: What Just Happened
Looking at the attached chart, we notice a clear pattern.
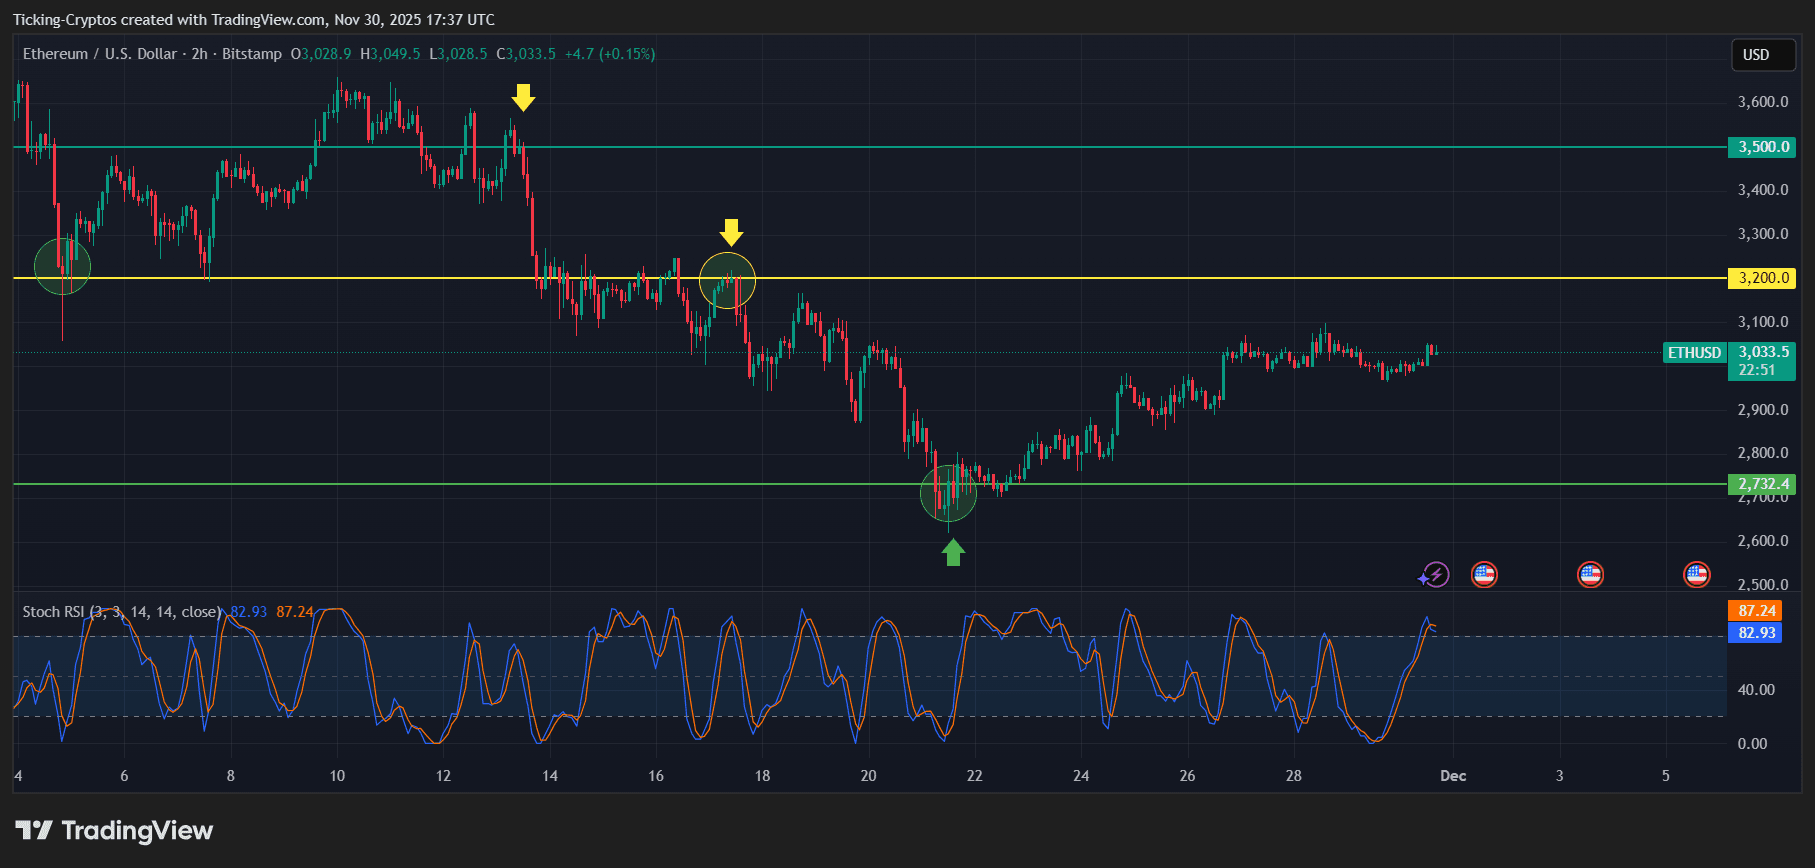
$ETH/USD 2-hour chart - TradingView
1. $ETH Rejected Repeatedly at $3,200 (Yellow Line)
The chart shows multiple rejections at $3,200, marked by yellow arrows and circles. This zone has acted as mid-range resistance for several weeks.
2. Strong Bounce From $2,732 Support (Green Line)
$ETH bottomed perfectly at the $2,732 structural support, where a green arrow confirms a high-volume reclaim. Each historical touch at this level triggered strong reversals.
3. Current Sideways Consolidation Around $3,030
$ETH is now stabilizing in a narrow band just under resistance — which often precedes a breakout attempt.
4. Stoch RSI Shows Overbought Momentum
The Stoch RSI currently reads:
- 82.93 (blue)
- 87.24 (orange)
$ETH is short-term overbought, meaning a brief cooldown may occur before continuation.
Ethereum Coin News: Key Levels to Watch
Support Levels
- $3,000 – short-term psychological support
- $2,960 – reclaimed technical support
- $2,732 – major macro support
Resistance Levels
- $3,200 – critical resistance that rejected multiple times
- $3,500 – major upside target
- $3,520 – 200-day MA and higher-timeframe resistance
Ethereum Price Prediction: Where will Ethereum Reach Next?
Based on the current chart structure, momentum signals, and market fundamentals:
Bullish Scenario (Most likely if $ETH holds above $3,000)
$ETH pushes higher from current consolidation.
Upside Targets
- $3,200 (first major breakout zone)
- $3,270 (38.2% Fibonacci level)
- $3,500 (strong resistance)
- $3,520 (200-day MA — key trend-flip level)
If $ETH closes above $3,500–$3,520, the next macro target opens toward $3,800+.
Bearish Scenario (If $ETH fails to hold $3,000)
A rejection at $3,200 could send $ETH into a corrective move.
Downside Targets
- $2,960
- $2,850
- $2,732 (critical support zone)
A breakdown below $2,732 would shift the trend into a mid-term bearish phase.