Ethereum price has had a massive run this month, gaining over 50% in July and bringing new excitement to the crypto market.
Many traders are already calling for $5,000 ETH, but before that milestone comes into play, the first real target sits near $4,500. The path to that level may not be smooth, though.
On-chain and trading data suggest one more pullback could happen before Ethereum pushes higher.
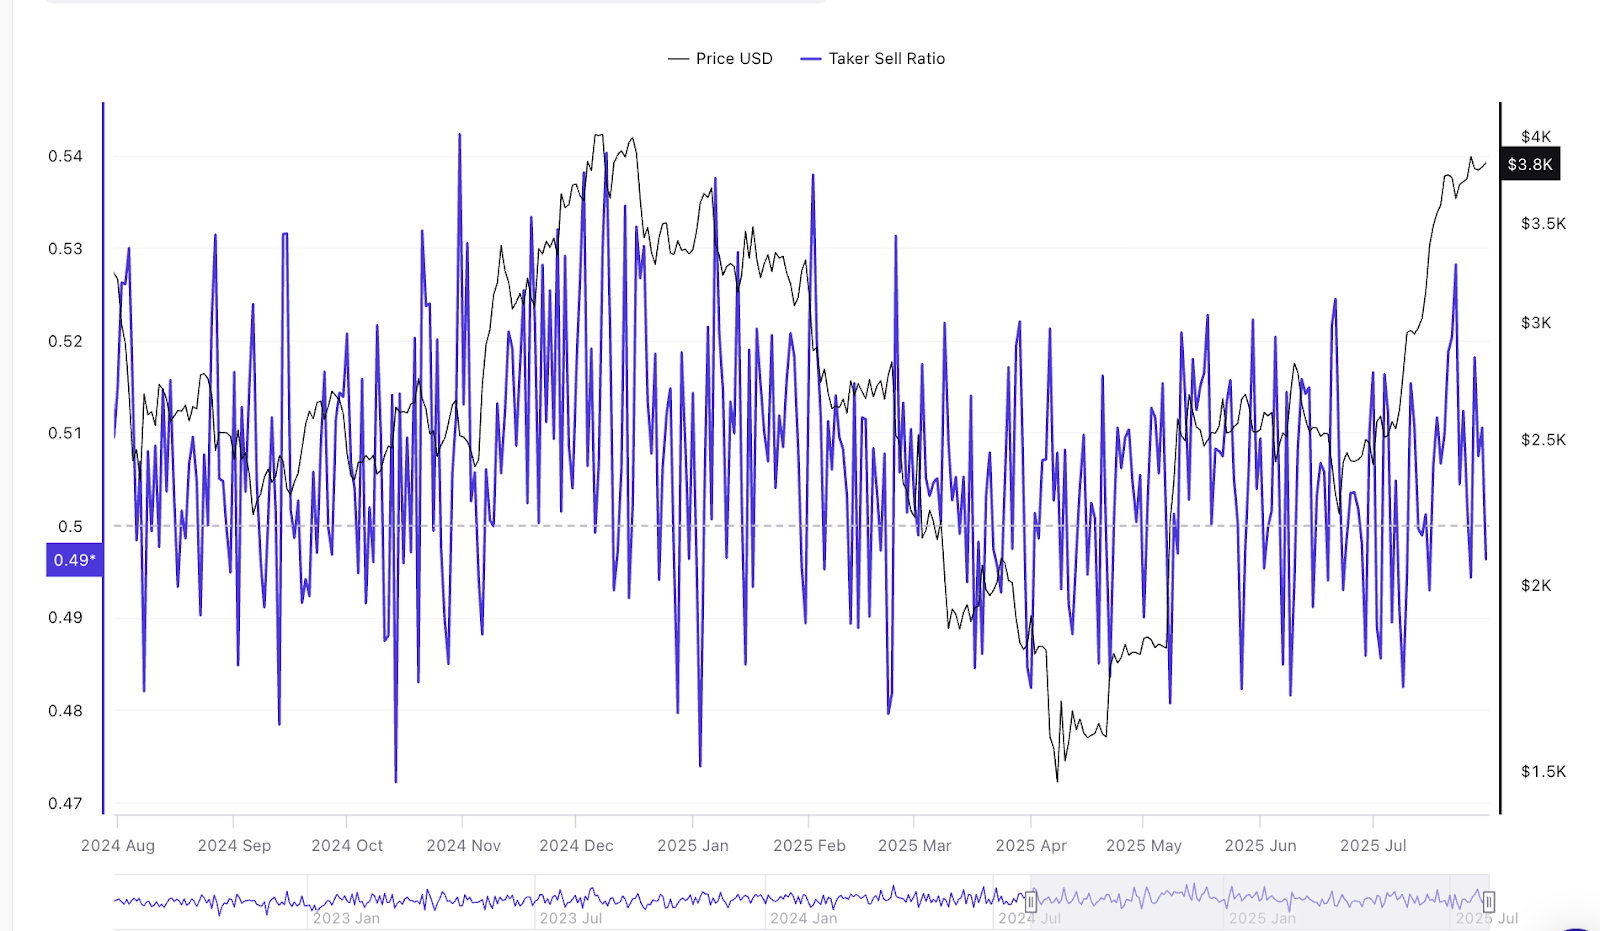
Sell Pressure Builds As Taker-Sell Ratio Spikes
The taker-sell ratio, which measures aggressive sell orders against buys, jumped to 0.52 on July 28. The last time this ratio hit these levels, back in April, ETH dropped almost 11%. The cryptocurrency fell from $3,200 to around $2,880 within days.
A higher taker-sell ratio means more traders are hitting the sell button at market price instead of waiting, a sign of fear or a rush to lock in profits.
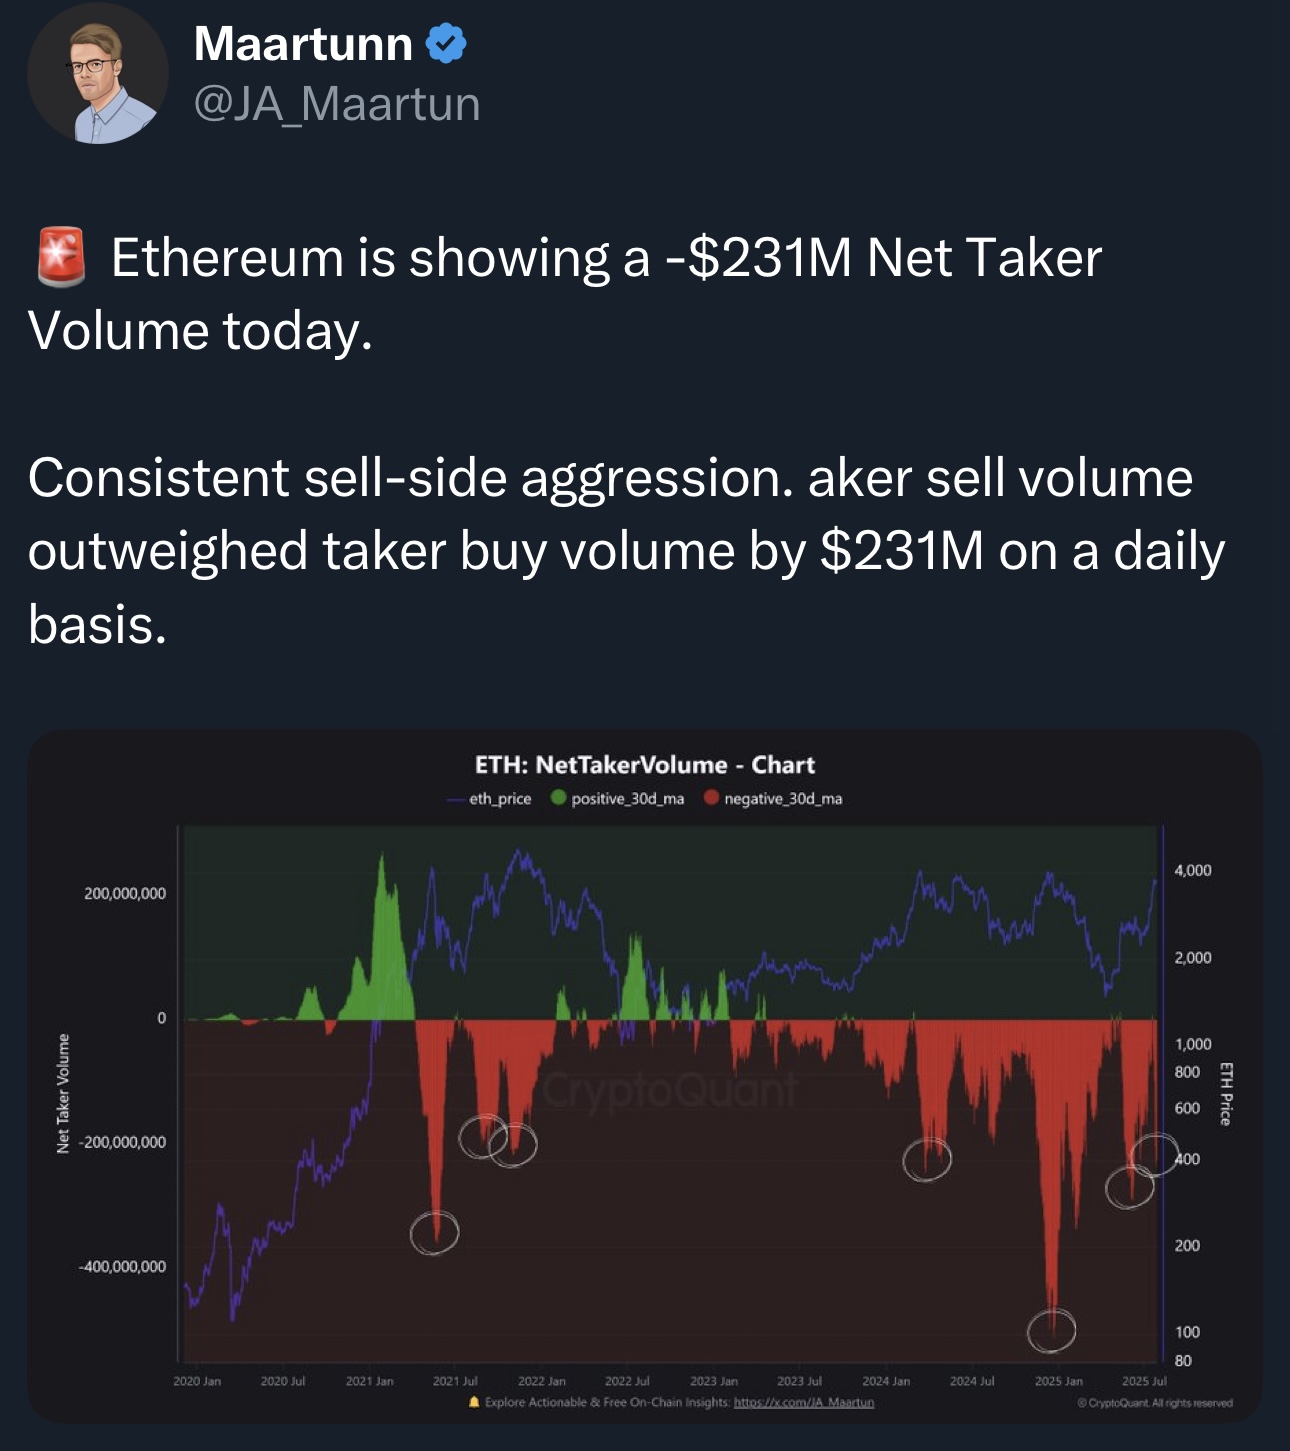
This sudden wave of sell orders has already shown up in net taker volume charts, where Ethereum recorded a -$231 million imbalance in favor of sellers.
Large bursts of taker-sell activity can trigger quick dips as liquidity thins out and stop-losses get hit. In simple terms, when everyone tries to sell at once, prices can slide fast, even in an uptrend.
Exchange Inflows Hint at Fresh Supply
On-chain data adds another layer of caution. ETH inflows to exchanges spiked to a 7-day average of 43 ETH (per key addresses), a zone previously tied to 40–45% corrections in earlier cycles.
When more coins move onto exchanges, it often means holders are getting ready to sell, creating extra supply that can weigh on price.
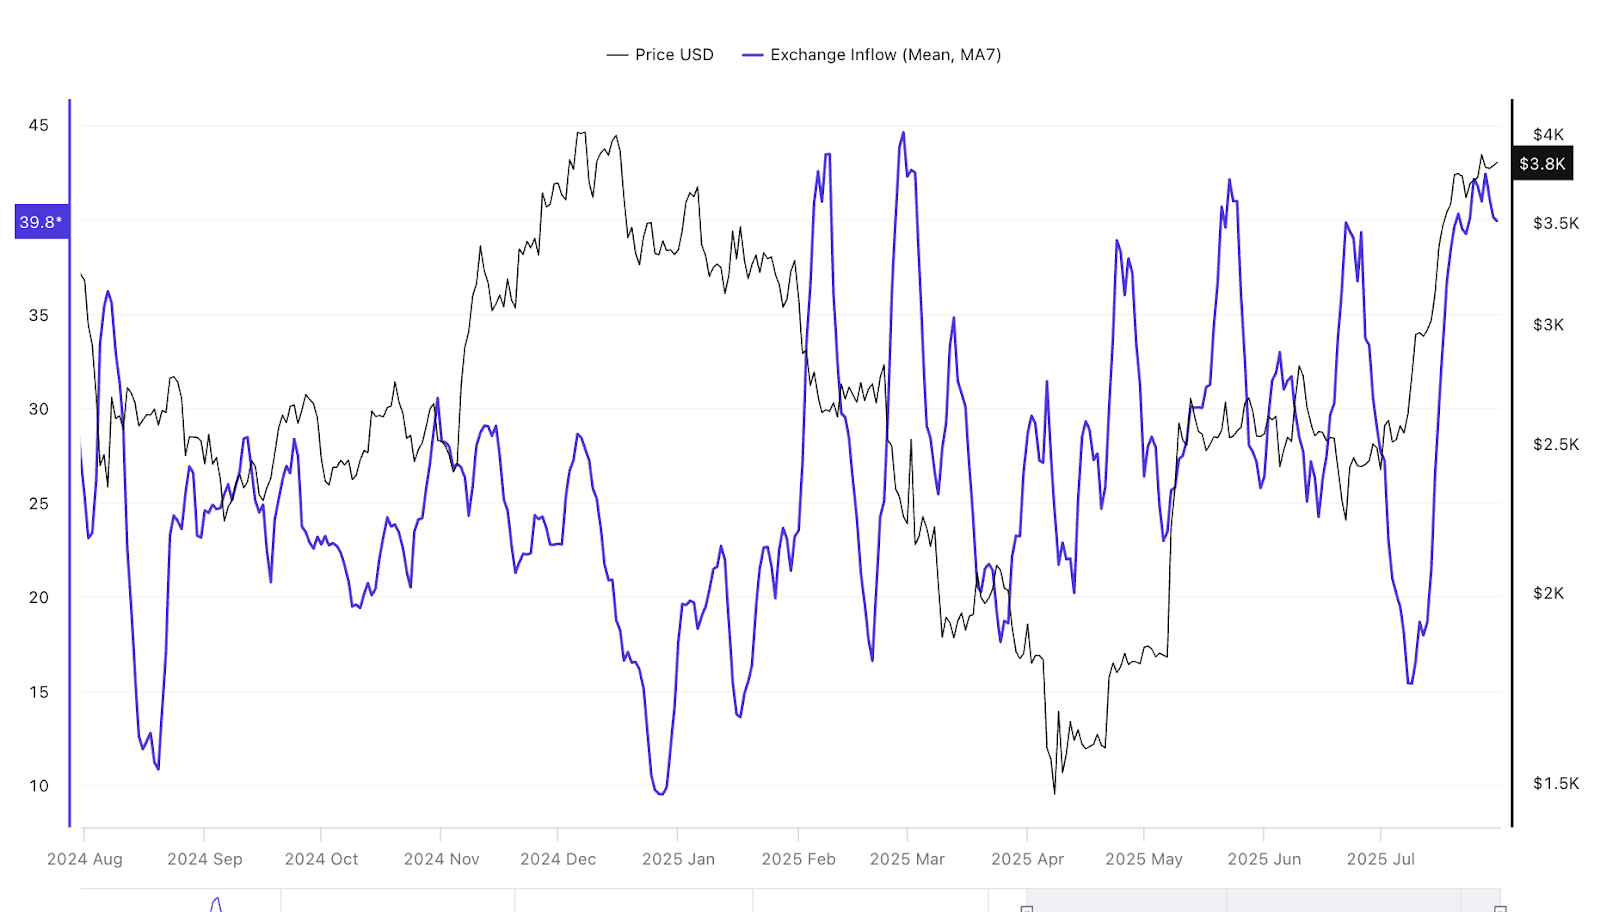
This doesn’t guarantee a crash, but historically, elevated inflows have marked local tops or at least sharp pullbacks before Ethereum rallies again.
If selling picks up alongside the current high-taker sell volume, ETH could test support levels closer to $3,500–$3,600 before finding fresh buyers. That would mean a close to 11% percent correction from the current levels.
Ethereum Price Structure Still Points Toward $4,500
Despite these short-term warning signs, the bigger picture still leans bullish.
Ethereum has been climbing steadily since June, and its structure on the daily chart shows higher highs and higher lows. The key resistance zone remains between $3,900 and $4,200.
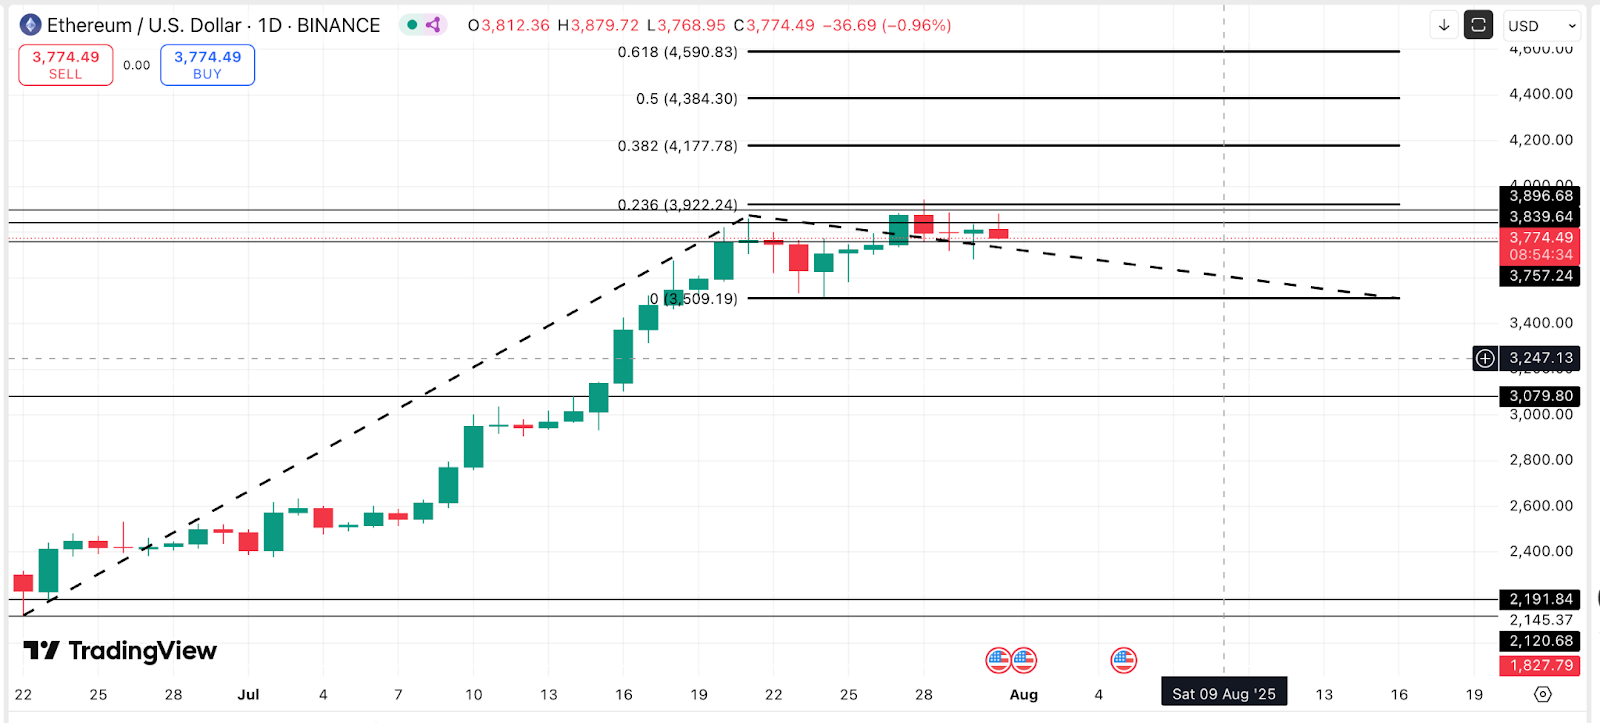
A clean breakout above this area, backed by strong volume, could pave the way for a move toward $4,500, in line with Fibonacci targets and market momentum.
Some analysts believe this shakeout could actually fuel the next leg higher.
If weak hands sell and leveraged shorts pile in, it sets the stage for a short squeeze. During this phase prices snap upward quickly as sellers are forced to buy back in. This pattern has played out before on ETH during previous high-inflow periods.
What To Watch Next
The next few days will be crucial for Ethereum traders. Keep an eye on:
- Taker-sell ratio: If it cools down below 0.50, it signals that selling pressure is easing.
- Exchange inflows: A drop in tokens moving to exchanges would suggest less near-term supply.
- Support levels: Holding above $3,600 keeps the bullish structure intact. A daily close above $3,900 could reignite momentum toward $4,500.
And yes, be mindful of other selling-heavy market signals shared by top X analysts.
For now, Ethereum’s rally is facing some turbulence, but the long-term trend hasn’t broken. A quick 10–11% dip wouldn’t mean the run is over; it might just be the reset ETH needs before charging toward its next big target.