Can Ethereum finally break free from its three-year prison and set a new all-time high by the end of 2025? That's the $72,000 question on Myriad—a prediction markets platform built by Decrypt’s parent company Dastan—where traders are putting real money on the line with increasingly bullish odds.
The market has generated over $72K in volume to date and has seen some wild swings over the last week. Just days ago, bears had taken control and set the odds at 53% that Ethereum would not hit an all-time high this year.
At the moment, though, Myriad users give ETH a 63.6% chance of surpassing its November 2021 peak of $4,891 before the clock strikes midnight on December 31, 2025.
With Ethereum already up a staggering 58% this month and institutional buyers piling in with billion-dollar purchases, the setup looks promising. But here's the rub: ETH has failed to break $4,000 nearly 10 times since 2021. So what makes this time different?
Ethereum price: What the charts are screaming
Looking at the weekly chart, there's one signal that has technical traders doing double-takes: the ever eye-popping “golden cross” on the daily movements.
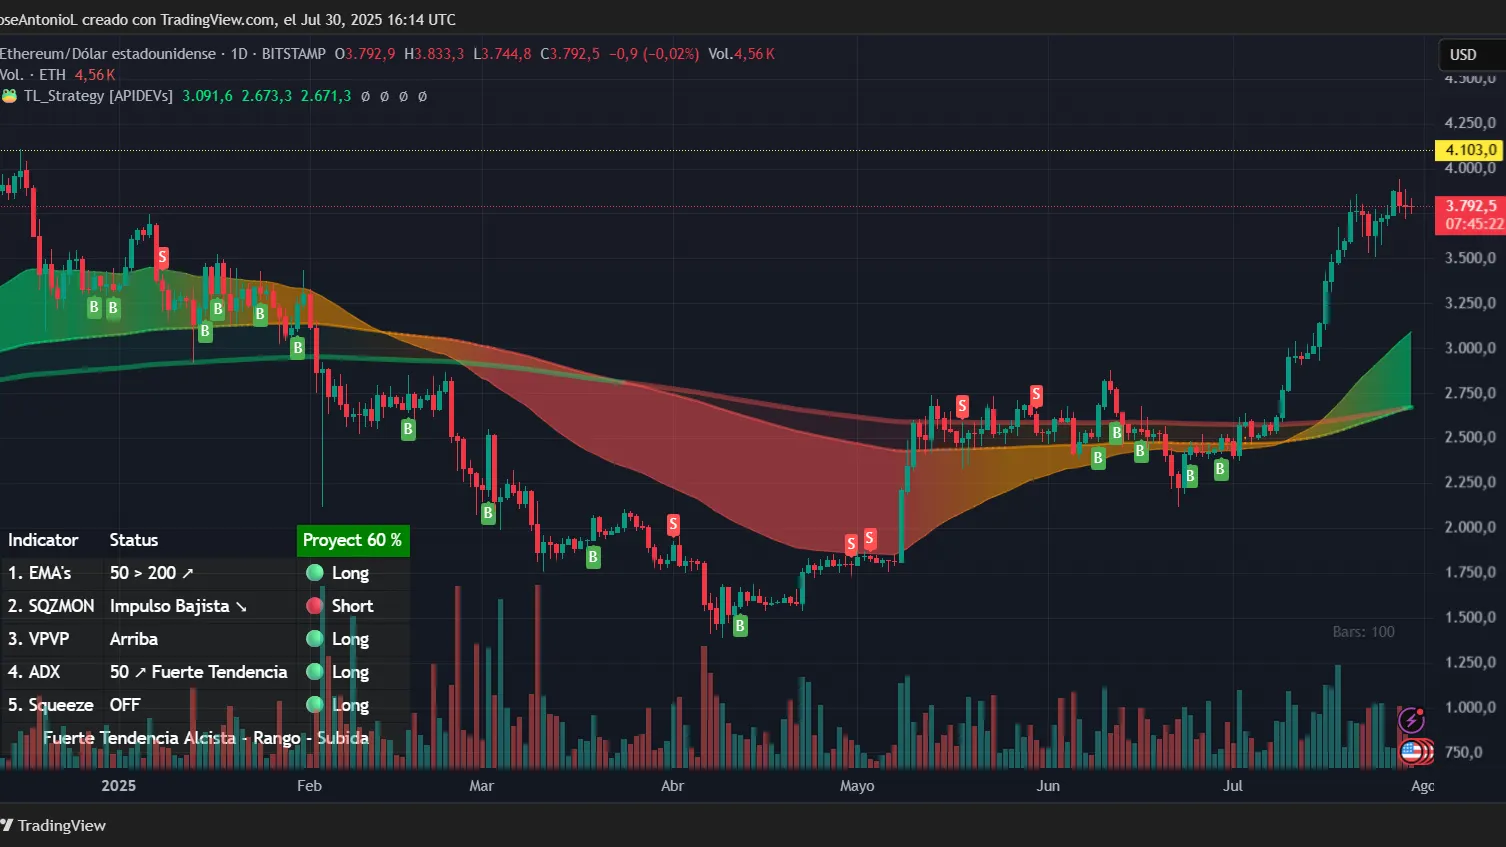
For the uninitiated, a golden cross happens when the average price of an asset over the last 50 days crosses above the average price over the last 200 days. It's like the crypto equivalent of a green light at a drag race. The last time Ethereum flashed this signal was last year. Those of you who have been following along will know that ETH began to form this pattern on the daily charts back on July 16. Well, now it’s fully in that golden zone.
On the weekly charts, on the other hand, the bullish configuration has been in place since 2022—even after the crypto winter, so long term hodlers have some level of reassurance that their coin isn’t going to dump big time.
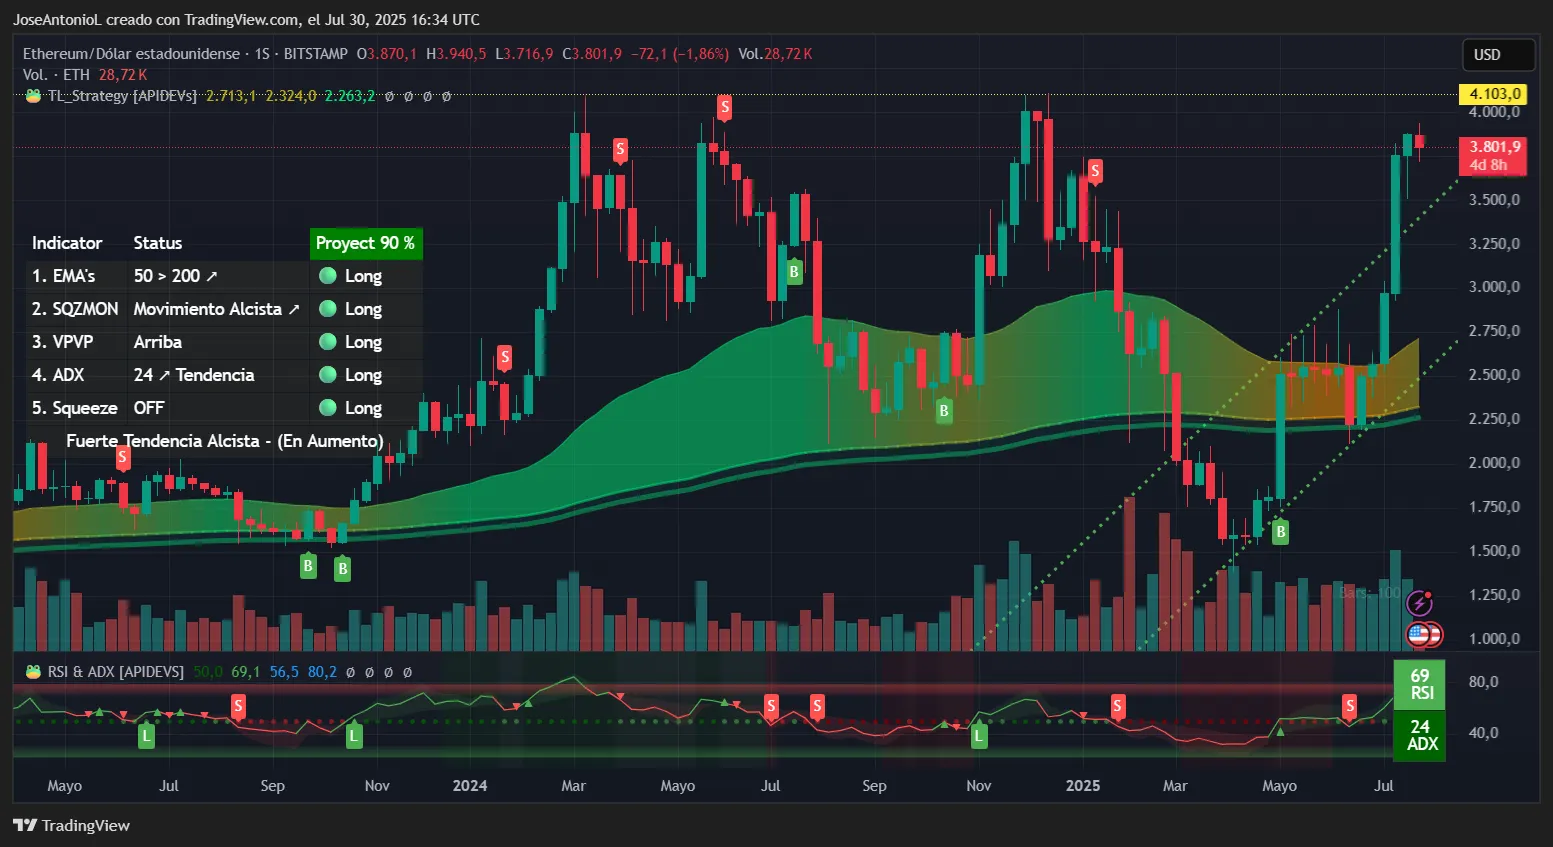
Considering there are still a few months before this market is closed, this is the configuration we’ll use for our analysis.
The Relative Strength Index, or RSI, sits at 69—elevated but not quite in nosebleed territory. You can think of RSI as a thermometer that tells traders how hot a market is, ranging from 0 to 100. During past all-time high runs, RSI readings for Ethereum typically pushed into the 75-85 range. In other words, there's still gas in the tank if bulls want to make a serious run at the record.
The Average Directional Index, or ADX, is at 24 for ETH. ADX measures trend strength, regardless of direction, and ETH right now is knocking on the door of 25—the magic number that confirms price trends. Once it crosses that threshold, momentum traders tend to pile in.
In terms of price patterns, the weekly trend beat a double top configuration that pushed ETH near $1,300 back in April. Since then, ETH prices have bounced and the token started to move up, following a bullish channel that has been in play throughout the year (the green dotted lines in the chart above).
Ethereum’s $4,000 problem
But let's talk about the elephant in the room: that cursed $4,000 level where ETH rallies go to die. Too many failed attempts since 2021 have turned this round number into a psychological fortress.
The Volume Profile—basically a heat map of where traders have been most active—shows massive resistance between $3,890 and $4,200. This is smart money territory, where institutional traders and whales have repeatedly taken profits. Breaking through requires more than hope and prayers; it needs serious volume and conviction.
So why are Myriad traders giving it 63.6% odds? Well, the math is actually pretty compelling.
As previously mentioned, the weekly chart shows ETH breaking its ascending channel, increasing its bullish momentum. If ETH bulls can sustain this momentum and previous resistance turns into new support, then prices should be at least $4,818 by New Year’s Eve, registering a new all-time high.
But if this doesn’t happen—even in a bullish scenario under the current bullish channel—prices may end up near $4,769—just shy of the $4,868 all-time high.
It’s a narrow probability, but likely still attractive enough for prediction market users to take.
Ethereum’s path to glory (or not)
For ETH to hit that new all-time high by year-end, a few dominoes need to fall. Here is the chart with the price trajectory until January 2026 (the vertical white line in the chart below).
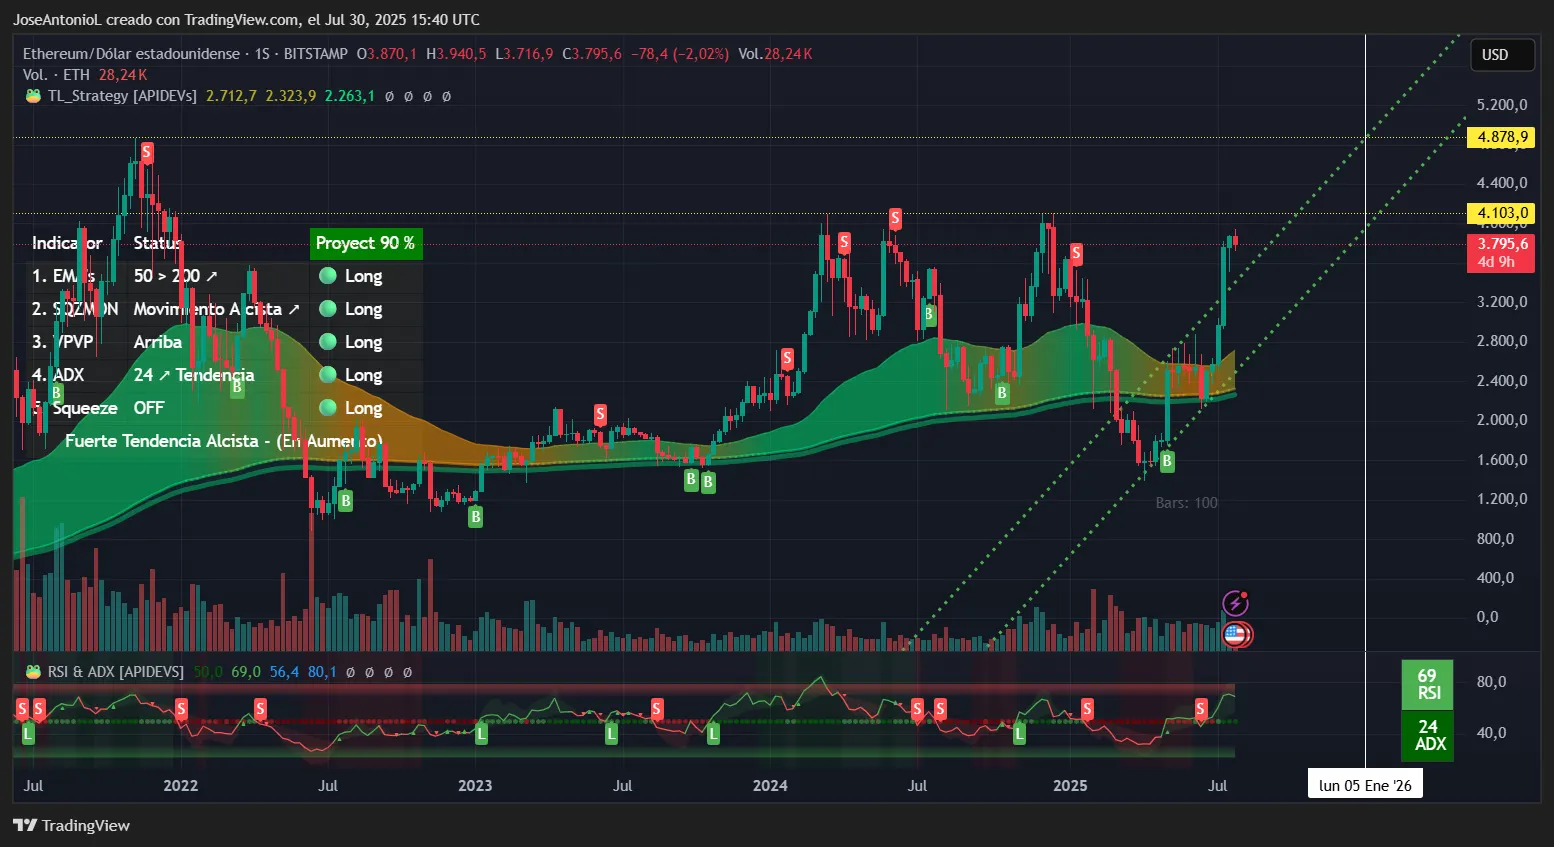
First, it needs to convincingly break $4,103—the local 2024 high. This isn't just about touching it; traders need a weekly close above with volume to confirm.
Second, the ADX needs to push above 25 to confirm we're in a trending market, not just another failed breakout attempt.
Third, we need the ascending channel to hold. A break below $3,100 would basically torpedo the entire thesis and likely send prediction market odds crashing. Ideally, for traders, the previous resistance must be confirmed as a new price support to talk about a new all-time high even if the bullish trend maintains direction but starts lacking momentum from now on. In other words, prices keep going up, just not as fast as before, but not so slow it starts to look like a flat trend.
Here's something the prediction market might be underestimating: the December 31 deadline falls on a Wednesday, but it's also New Year's Eve. Trading volumes typically thin out during the holidays, making sustained moves above resistance levels trickier. It’s possible, though, that predictors are expecting ETH to break its record price well before the resolution date.
On the flip side, an all-time high is not marked by a closing candlestick but a wick, so even a second of market hype after a big institutional buy, a brief pump, a small glimmer of hope can be enough to trigger a new price record.
So you're saying there's a chance
Based purely on the charts, Ethereum hitting a new all-time high by year-end doesn’t seem like such a crazy idea. The golden cross, a rising trend, and institutional accumulation all point to higher prices ahead.
But—and this is a big but—that $4,000 resistance zone has crushed dreams before. The 63.6% odds on Myriad seem about right, maybe even a touch conservative given the technical setup.
For prediction market players, the current pricing offers an interesting proposition. At 63.6 cents for “yes” shares, you're looking at a potential 57% return if ETH cooperates. The key is watching those critical levels: hold above $3,100, break above $4,103, and pray the Fed doesn't throw any curveballs.
Key levels to watch:
- Make it or break it: $4,103 (must close above on the weekly)
- Thesis intact: $3,100 (drop below = run for the exits)
- The promised land: $4,891 (current ATH and target)
- Stretch goal: $5,200 (upper channel projection)
Remember, this is crypto—where a single tweet, whale move, or regulatory announcement can flip the script faster than you can refresh your portfolio. The charts say "yes," the prediction market says "probably," but as always in this game, nothing's guaranteed except volatility.
Disclaimer
The views and opinions expressed by the author are for informational purposes only and do not constitute financial, investment, or other advice.