After reclaiming the $3,325 supply zone earlier this week, Ethereum price has launched into a vertical rally, rising more than 20 percent in just three sessions. Ethereum price today is trading around $3,655, its highest level since early 2024. The move is driven by a confirmed breakout from a long-term triangle structure. Bullish continuation now hinges on ETH holding above key former resistance levels.
What’s Happening With Ethereum’s Price?
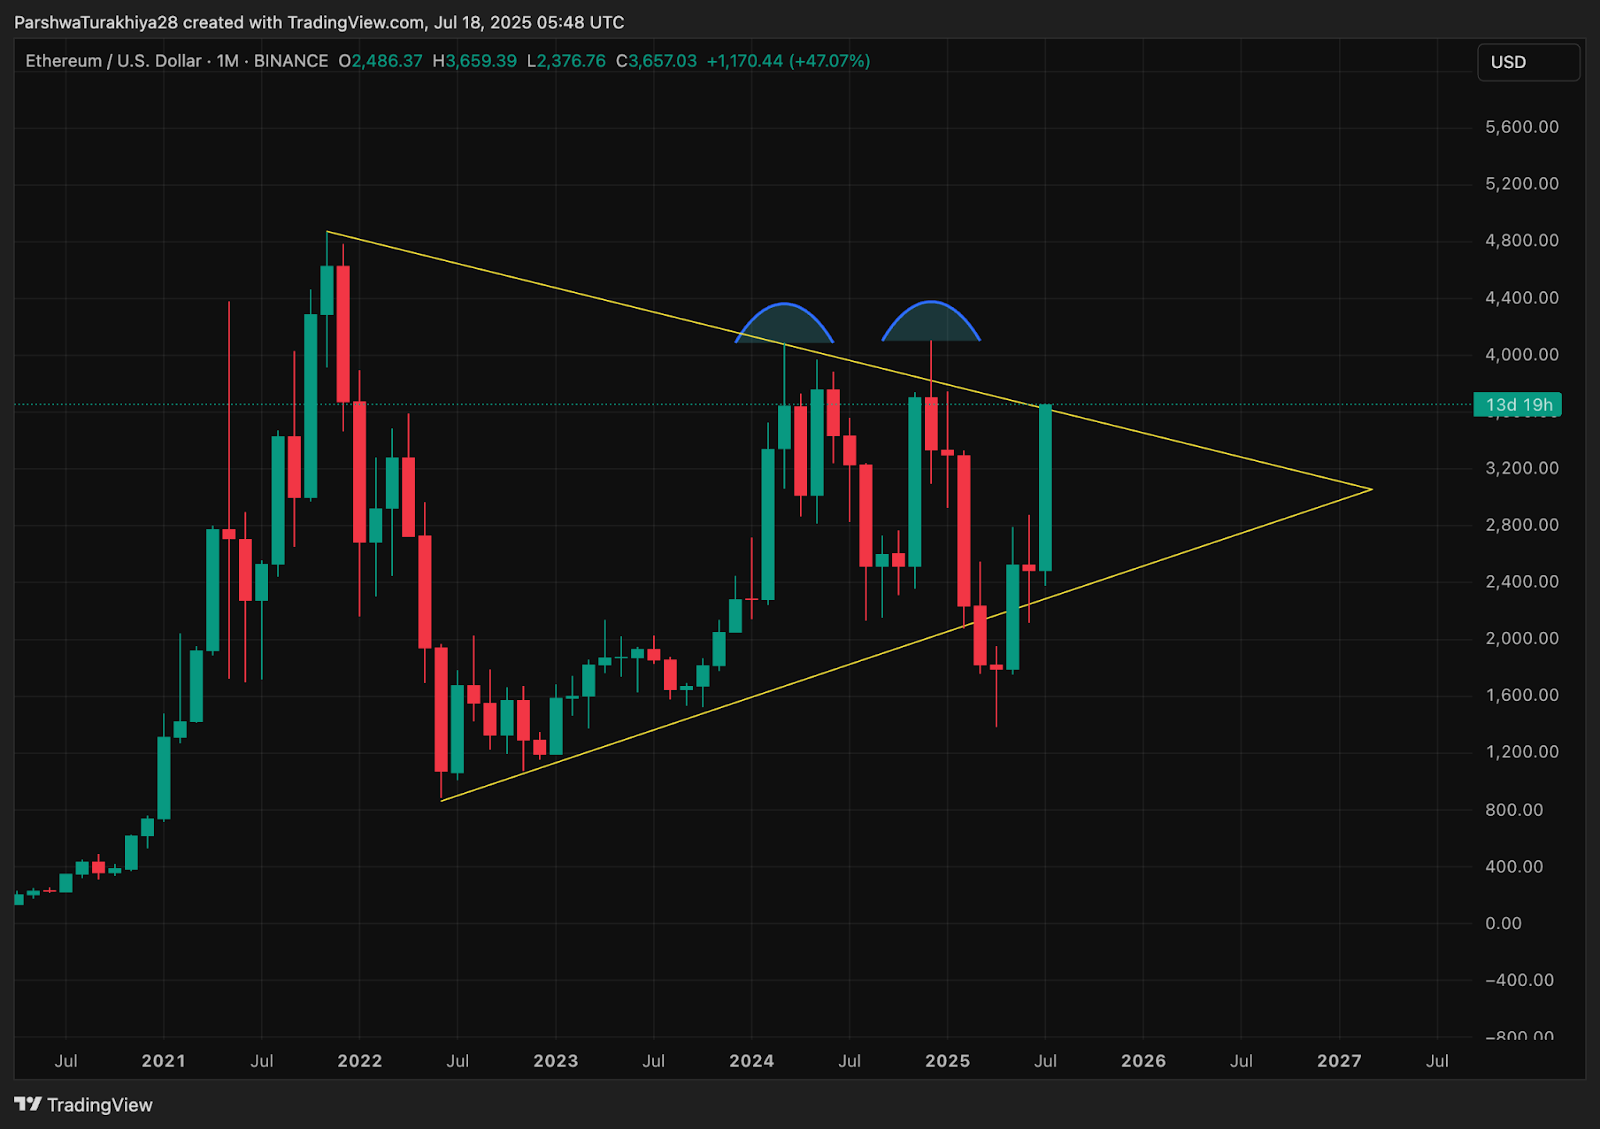
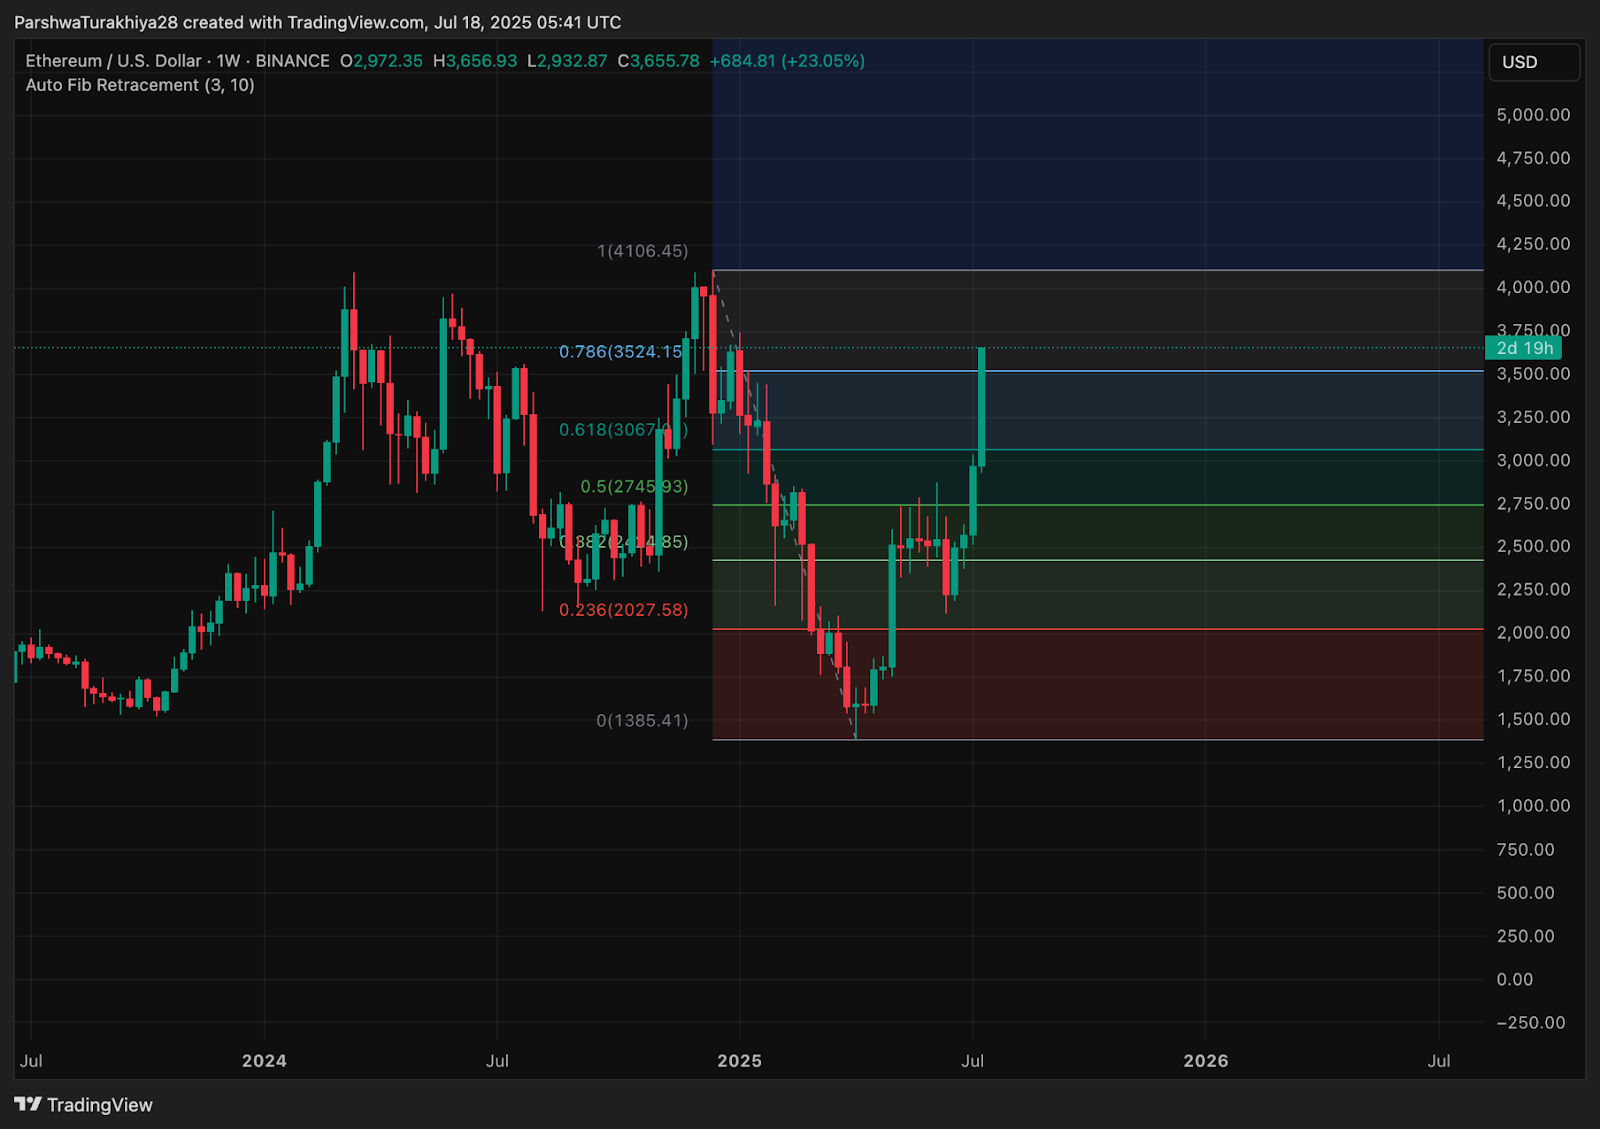
The weekly chart shows that Ethereum price has surged past the 0.618 Fibonacci retracement level at $3,067 and is now approaching the 0.786 level near $3,524. This rally is unfolding just after ETH confirmed a breakout from the multi-year symmetrical triangle visible on the monthly chart. That structure has capped ETH since 2022, and the breakout candle now reflects a long-awaited shift in macro trend.
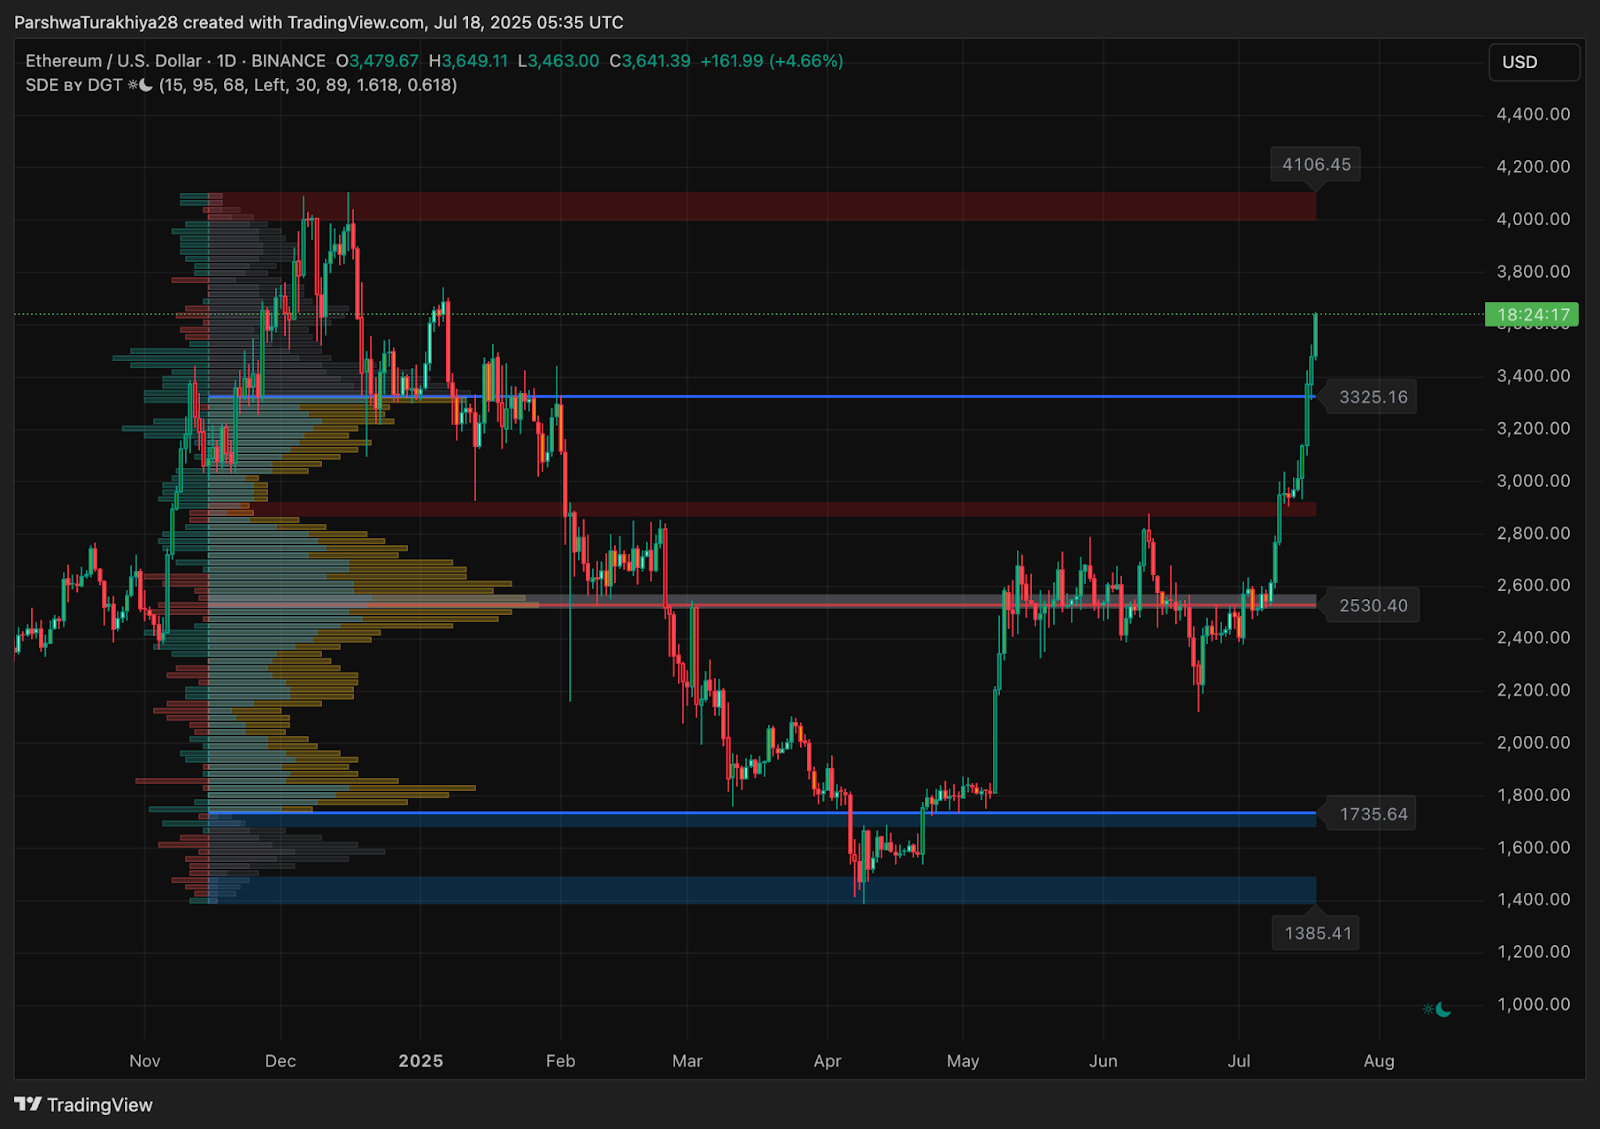
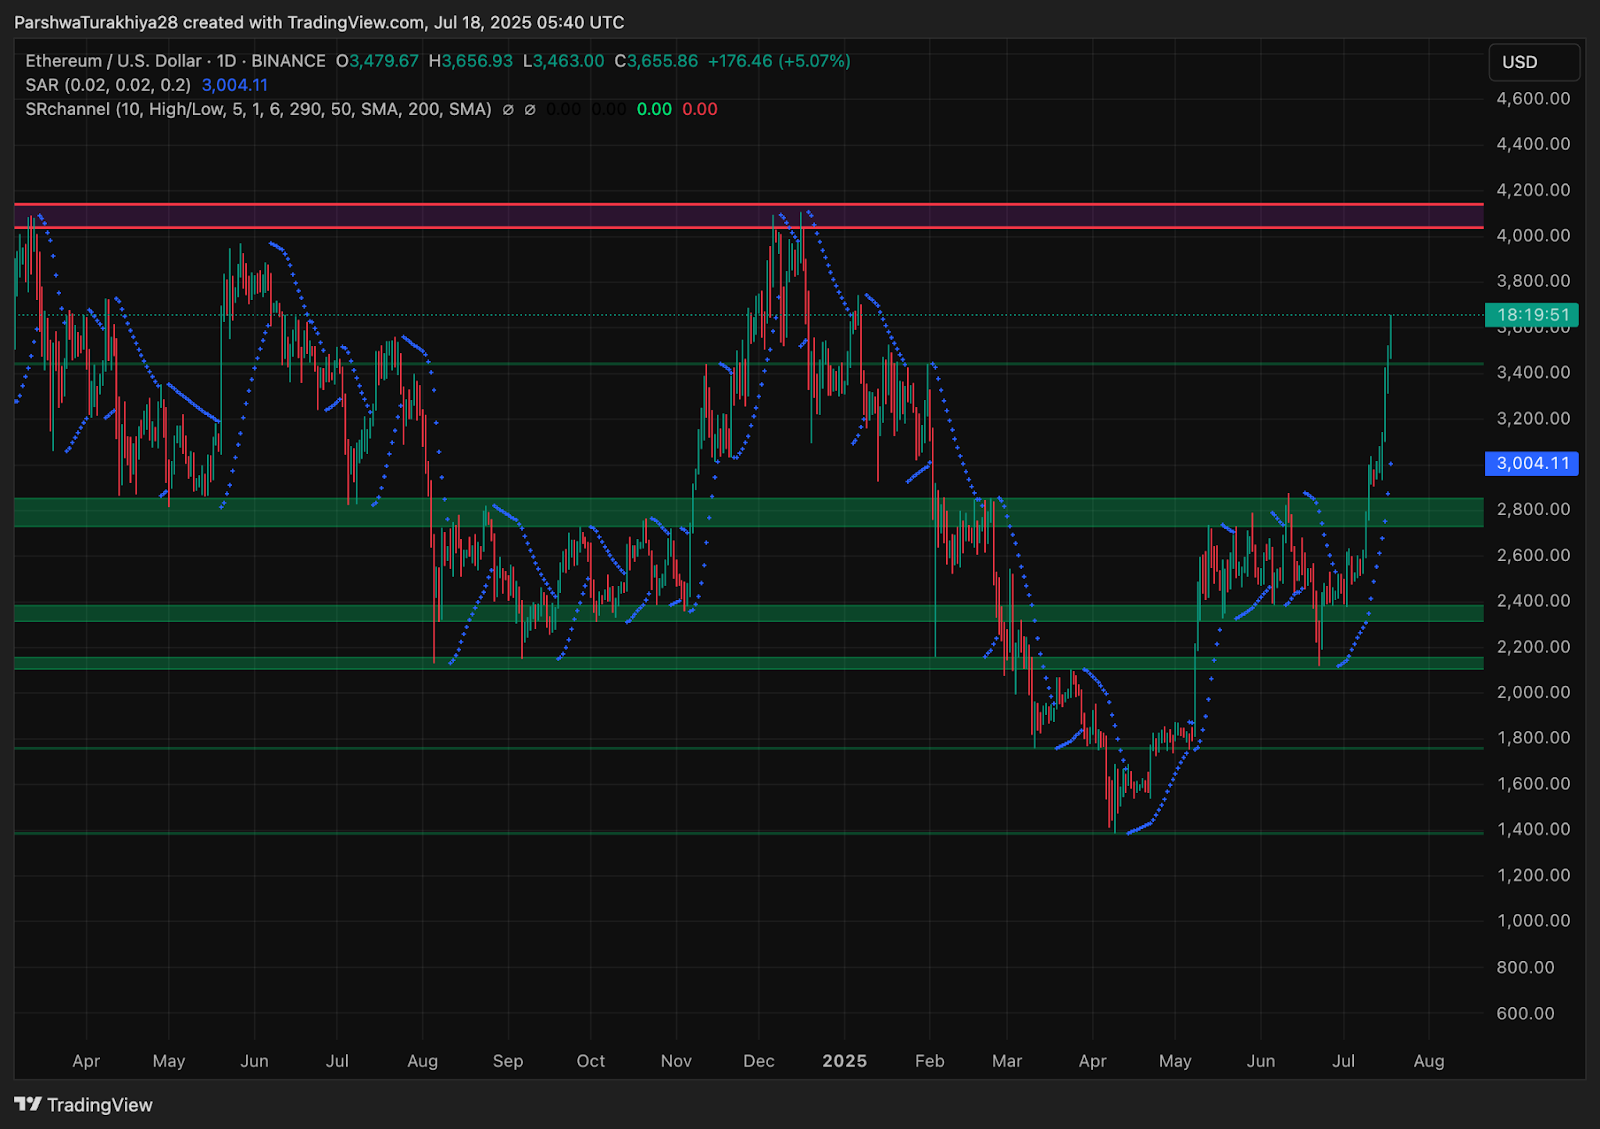
On the daily timeframe, ETH cut through major levels including $2,530 and $3,325 with strong momentum. The volume profile highlights a low-liquidity pocket between $3,500 and $3,700, increasing the chances that price continues climbing toward the $4,100 zone. Volume expansion has supported the move, and no significant supply zones have been encountered yet.
Why Is The Ethereum Price Going Up Today?
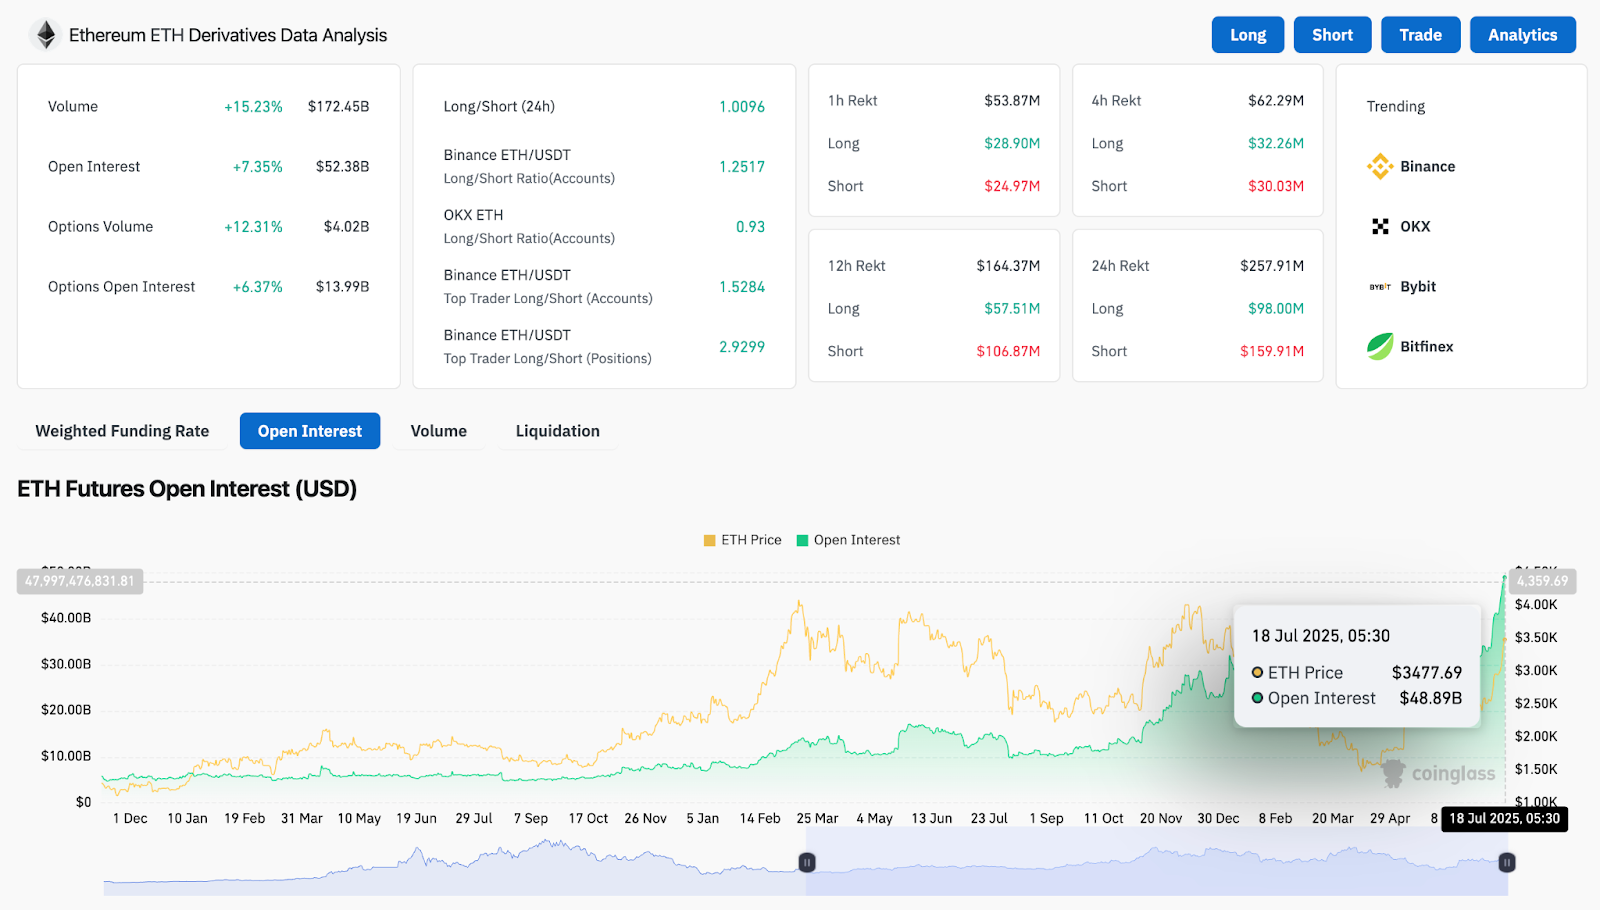
The powerful rally in Ethereum price today is supported by strong derivatives flow and market participation. As per Coinglass, ETH open interest is up 7.35 percent at $52.38 billion while volume has jumped 15.23 percent to $172.45 billion. The Binance long-short ratio stands at 2.92 for top traders, indicating a heavy preference toward long positions.
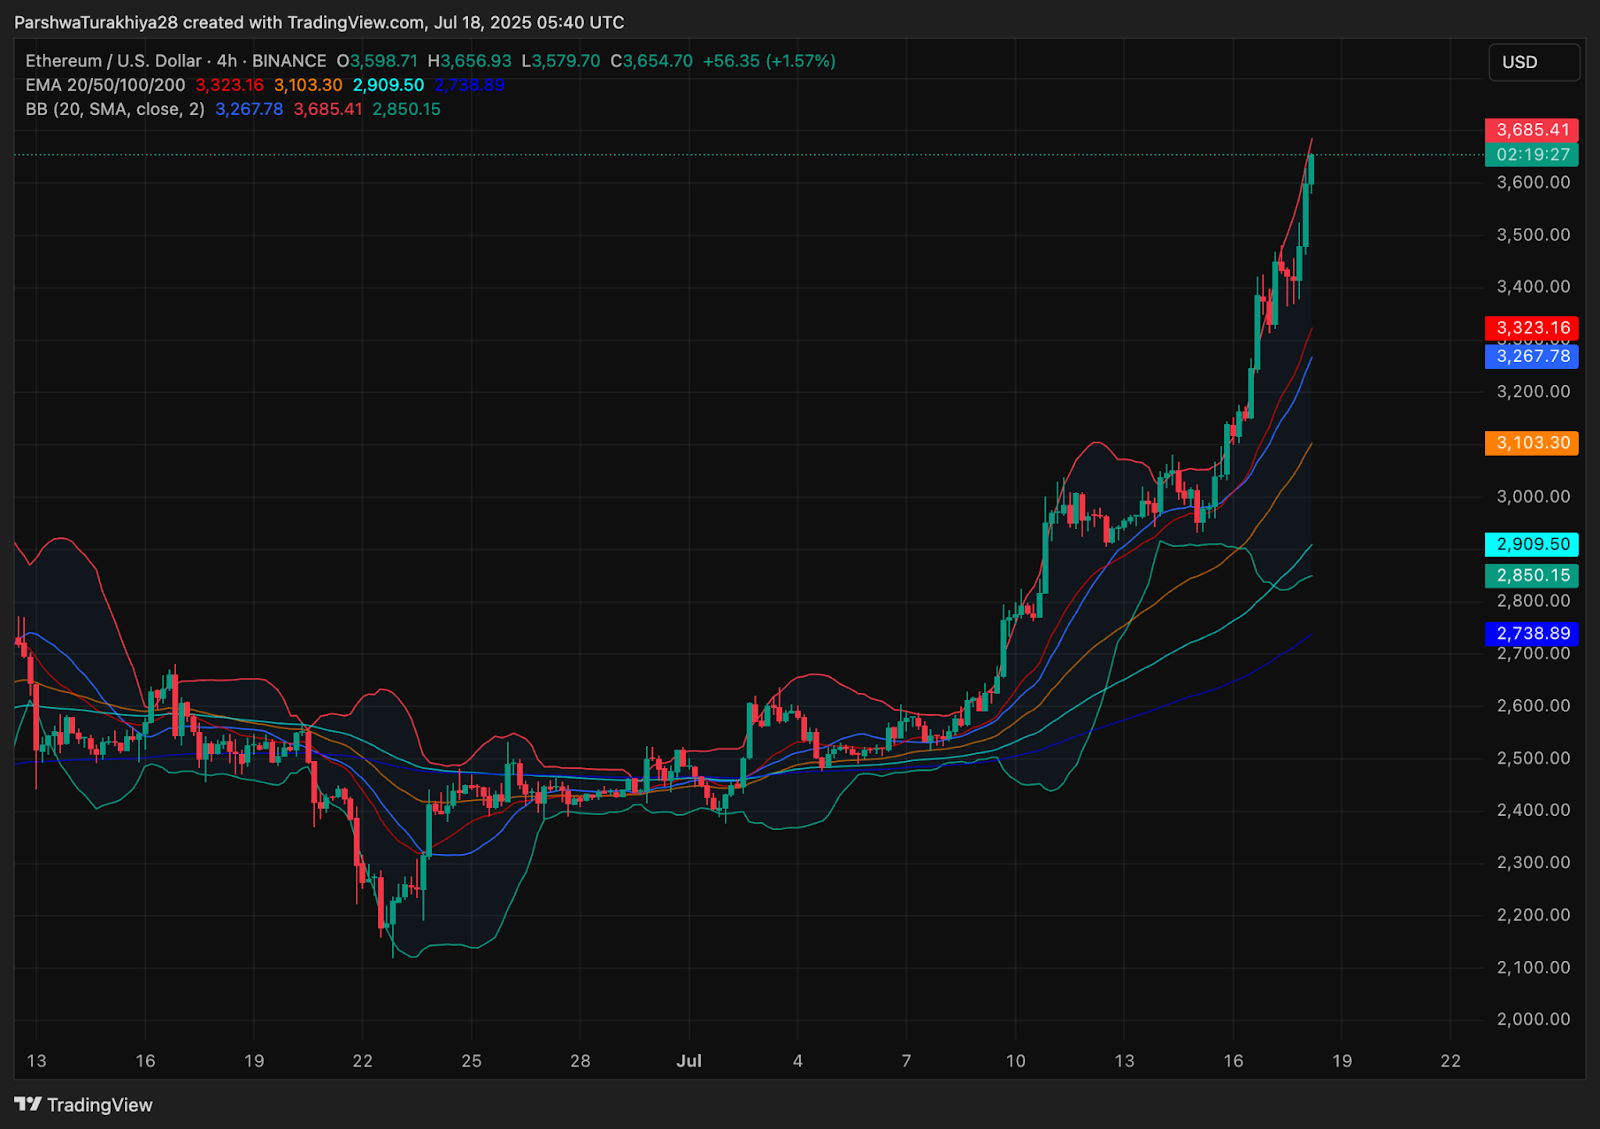
Technically, Ethereum price action on the 4-hour chart is supported by a bullish EMA alignment. The 20 EMA at $3,323 and the 50 EMA at $3,103 are now well below the current price. The MACD remains positive and the RSI, while overbought, continues to show no bearish divergence. Parabolic SAR dots have flipped below price on the daily timeframe, confirming bullish trend control.
ETH had earlier consolidated near $2,900 and formed a solid base before breaking out. That consolidation zone now acts as the first structural support if a pullback occurs.
ETH Price Signals Volatility Expansion Above $3,600
Bollinger Bands on the 4-hour timeframe are widening significantly, suggesting the rally is entering a high-volatility expansion phase. Ethereum price is hugging the upper band, which is a typical characteristic of trending moves. Despite overbought RSI readings, the lack of reversal signals means bulls remain in full control for now.
The daily price structure shows ETH holding firmly above $3,600. The $3,325 level now acts as the closest support, while $4,100 stands as the next major resistance. This area also coincides with the full Fibonacci retracement from the 2024 high, making it a key level to watch.
VWAP readings indicate that price is trading comfortably above the average session level, and there is no immediate weakness on lower timeframes.
Ethereum Price Prediction: Short-Term Outlook (24H)
As long as Ethereum price today holds above $3,325, short-term bullish control remains intact. A successful retest of the $3,525 to $3,600 zone could propel ETH toward $3,850 and eventually $4,106. That area marks the full Fibonacci retracement and also aligns with heavy historical resistance.
If bulls fail to defend $3,325, the price could slide back toward the $3,103 EMA region or the broader $2,900 consolidation base. However, with open interest rising, trend structure flipped bullish, and derivative data showing strong long interest, the bias remains in favor of continuation toward $4,000 in the coming sessions.
Ethereum Price Forecast Table: July 19, 2025
| Indicator/Zone | Level / Signal |
| Ethereum price today | $3,655.86 |
| Resistance 1 | $3,850 |
| Resistance 2 | $4,106 |
| Support 1 | $3,325 |
| Support 2 | $3,103 |
| Weekly Fib Level (0.786) | $3,524 (now above) |
| Parabolic SAR (1D) | Bullish, dots below price |
| EMA Cluster (4H) | All stacked below current price |
| Bollinger Bands (4H) | Expanding sharply |
| RSI (4H) | Overbought, no divergence |
| MACD (4H) | Bullish momentum |
| Derivatives Volume | +15.23%, long-heavy bias |
| Open Interest | $52.38B (+7.35%) |
| VWAP | Price trades above |
Disclaimer: The information presented in this article is for informational and educational purposes only. The article does not constitute financial advice or advice of any kind. Coin Edition is not responsible for any losses incurred as a result of the utilization of content, products, or services mentioned. Readers are advised to exercise caution before taking any action related to the company.