After a sharp climb last week, Ethereum price today is stabilizing just below the $2,600 mark. The short-term structure is forming a tight range as buyers attempt to hold key moving averages while watching volume signals for a potential breakout above local resistance.
What’s Happening With Ethereum’s Price?
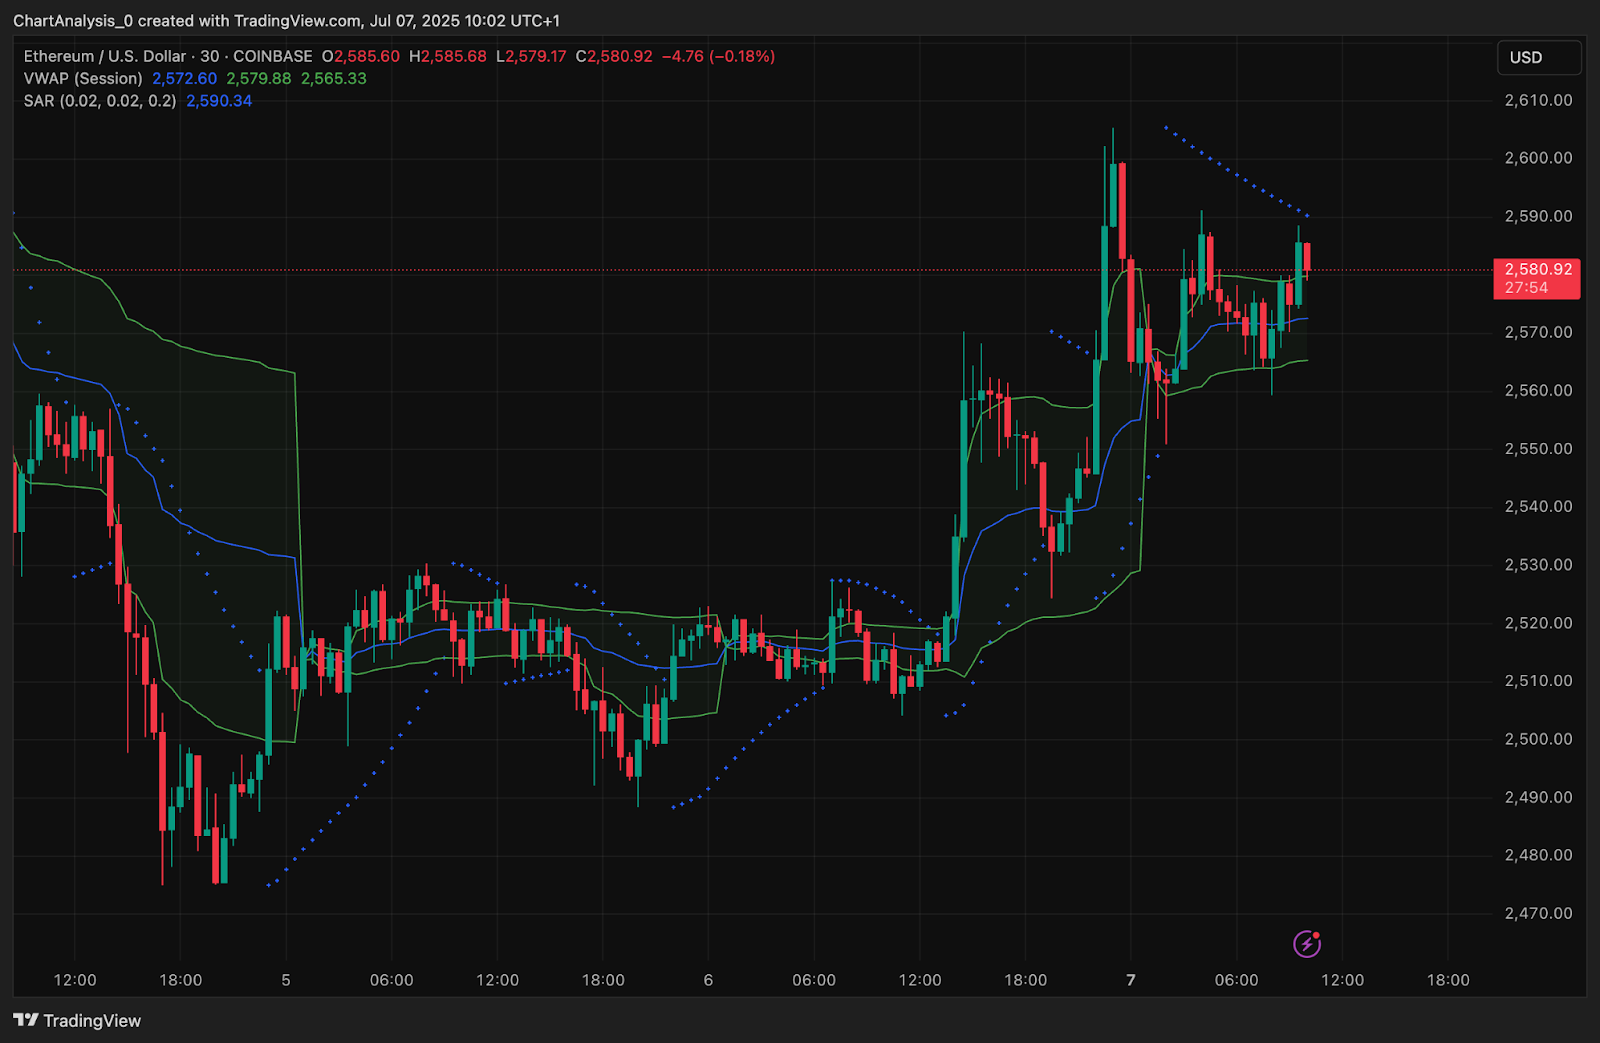
On the 30-minute and 4-hour charts, Ethereum price has been consolidating between $2,560 and $2,590 after a sharp breakout on July 6. Price is riding along the mid-line of Bollinger Bands while staying above the VWAP and Parabolic SAR flip levels near $2,572 and $2,565, respectively. This suggests ongoing buyer interest despite a lack of immediate momentum.
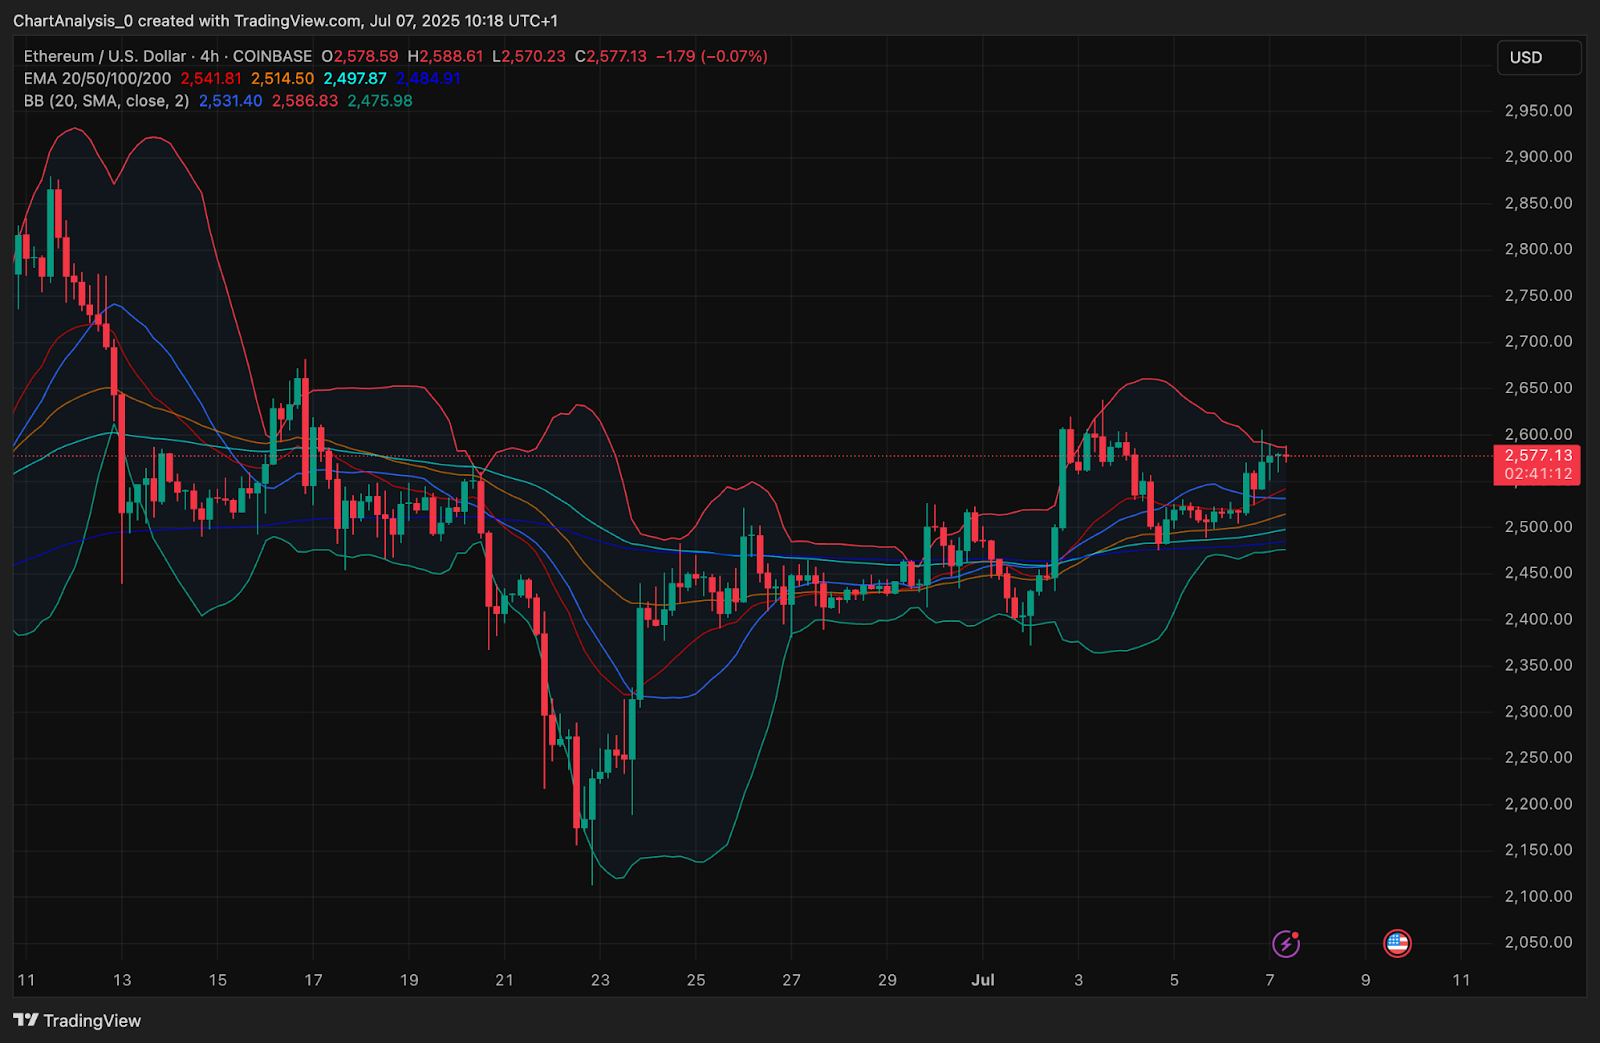
The 4-hour Bollinger Bands have slightly expanded, allowing ETH to stretch higher without immediate rejection. Notably, the price is holding above the 20, 50, 100, and 200 EMAs, which are now stacked in a bullish alignment between $2,541 and $2,497. This dynamic cluster reinforces support and hints at a potential continuation setup.
Why Ethereum Price Going Up Today?
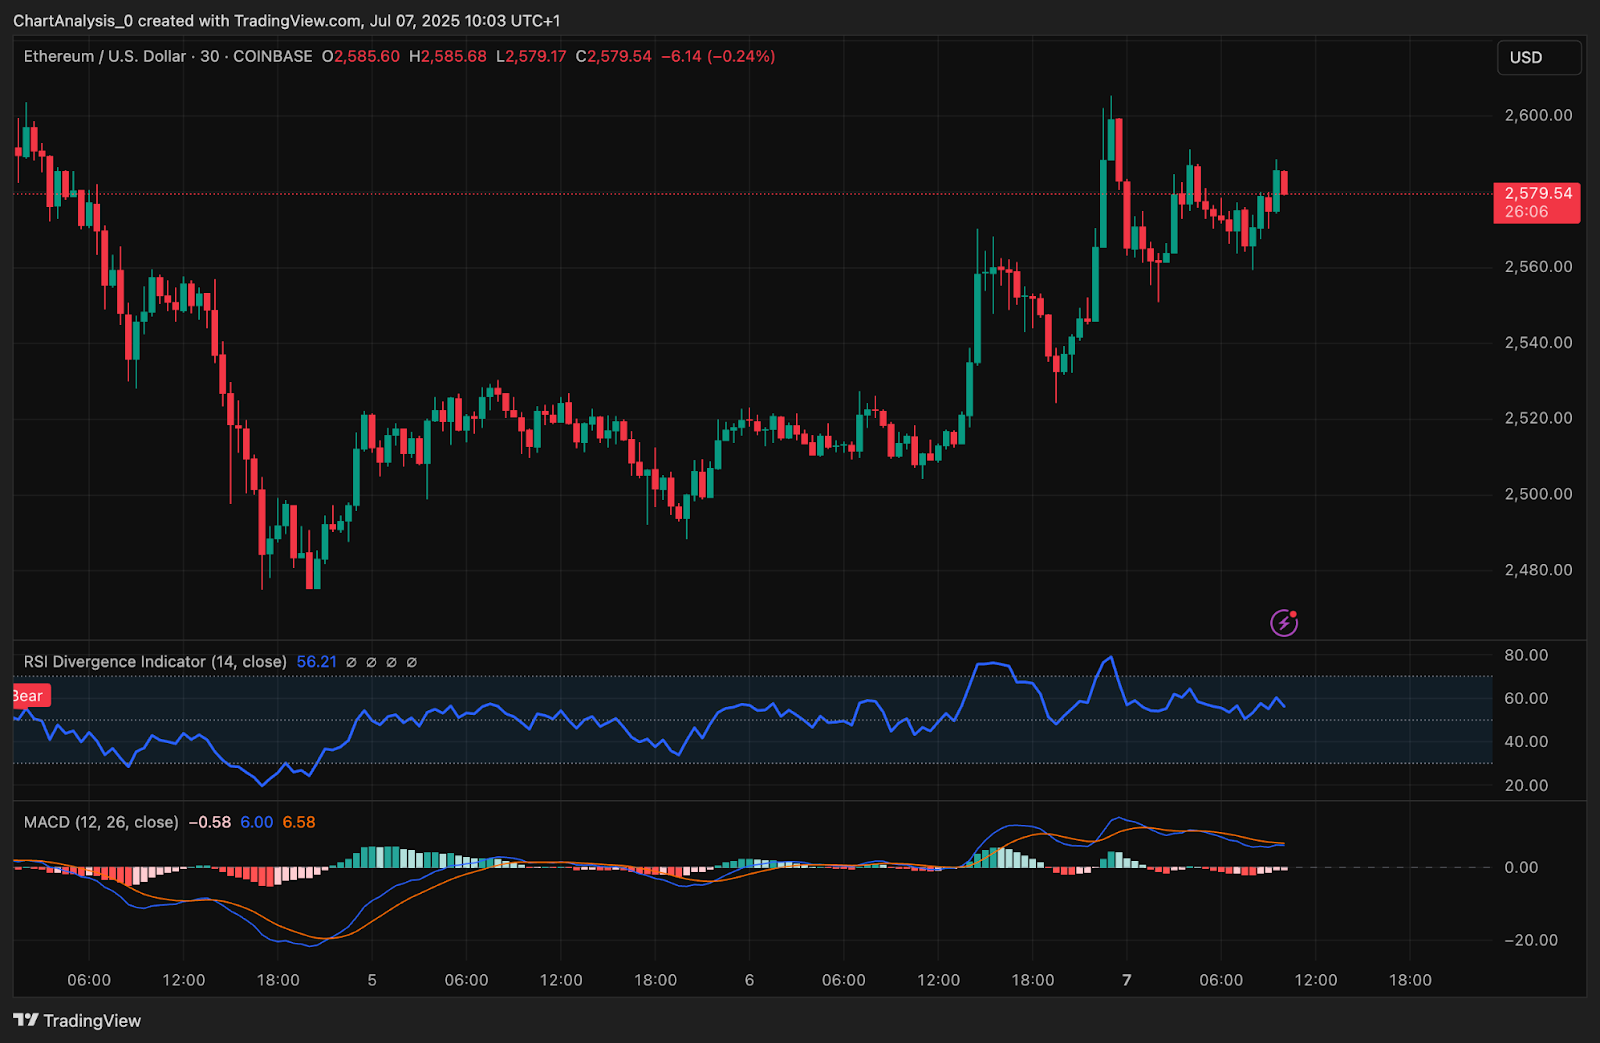
The mild upward bias in Ethereum price today is supported by a favorable mix of momentum and derivatives positioning. On the 30-minute chart, RSI holds at 56.2, indicating moderate bullish momentum without being overbought. MACD is near a neutral crossover, suggesting consolidation rather than active selling.
From a Smart Money Concepts (SMC) view, ETH has held above its most recent BOS (break of structure) and internal CHoCH levels near $2,540, while forming equal highs around $2,600. This offers a bullish context if price can reclaim and close above $2,590.
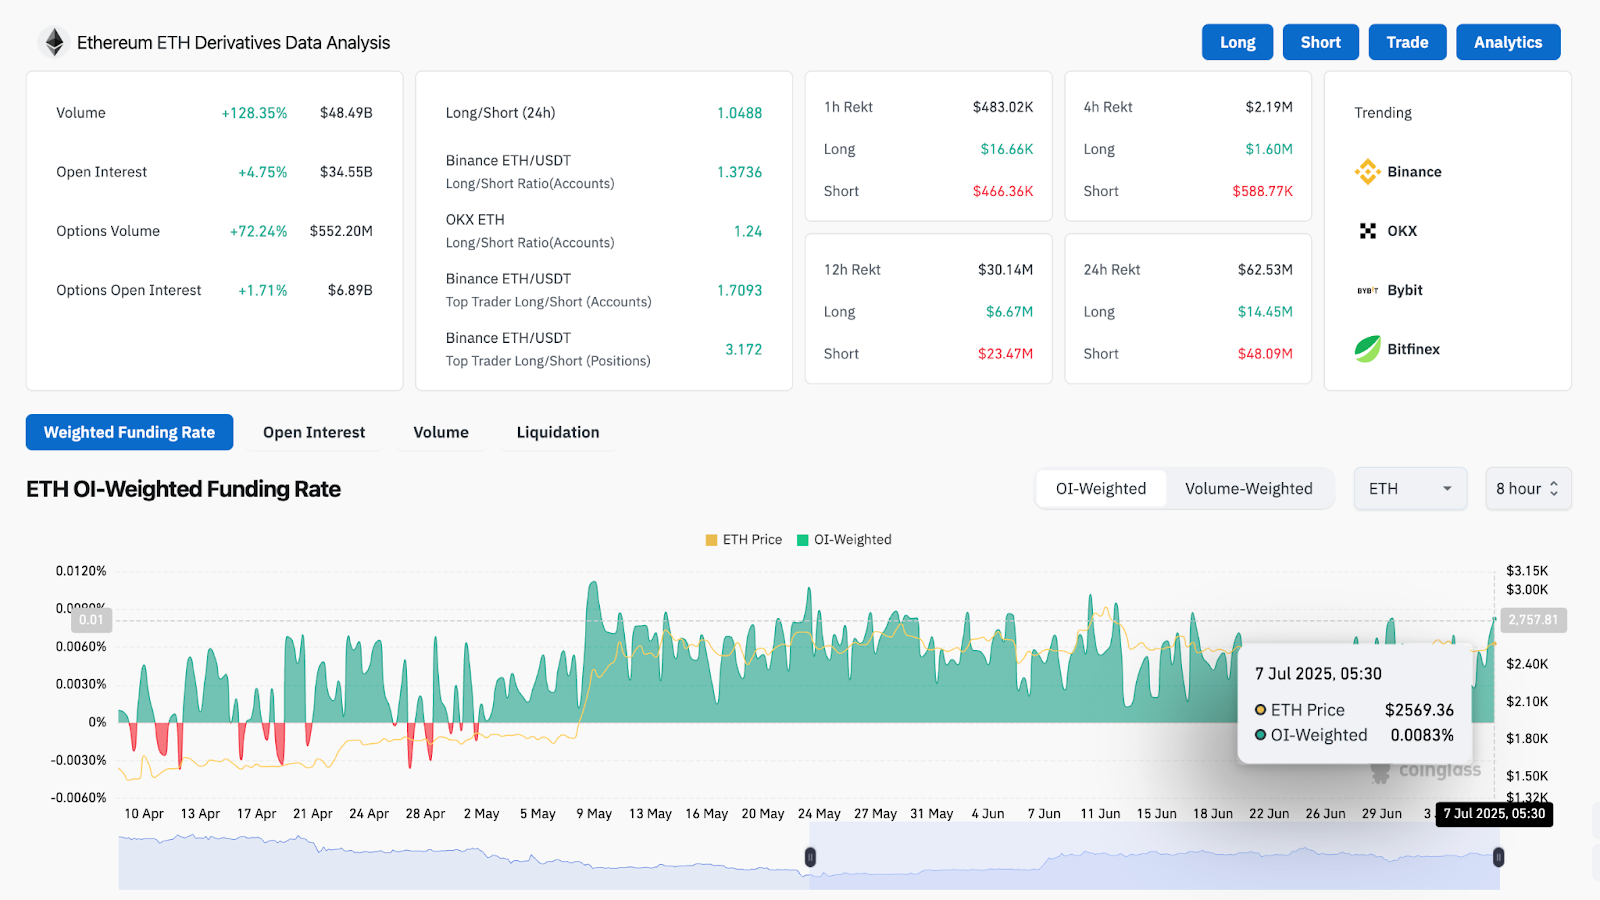
In the derivatives market, Coinglass data shows a 128% surge in ETH trading volume to $48.49B, with open interest up by nearly 5% and options volume jumping 72%. Binance top trader long/short ratios are significantly skewed (3.17), reflecting long-heavy positioning and confidence in upside continuation.
ETH Price Indicators Signal Compression Breakout Potential
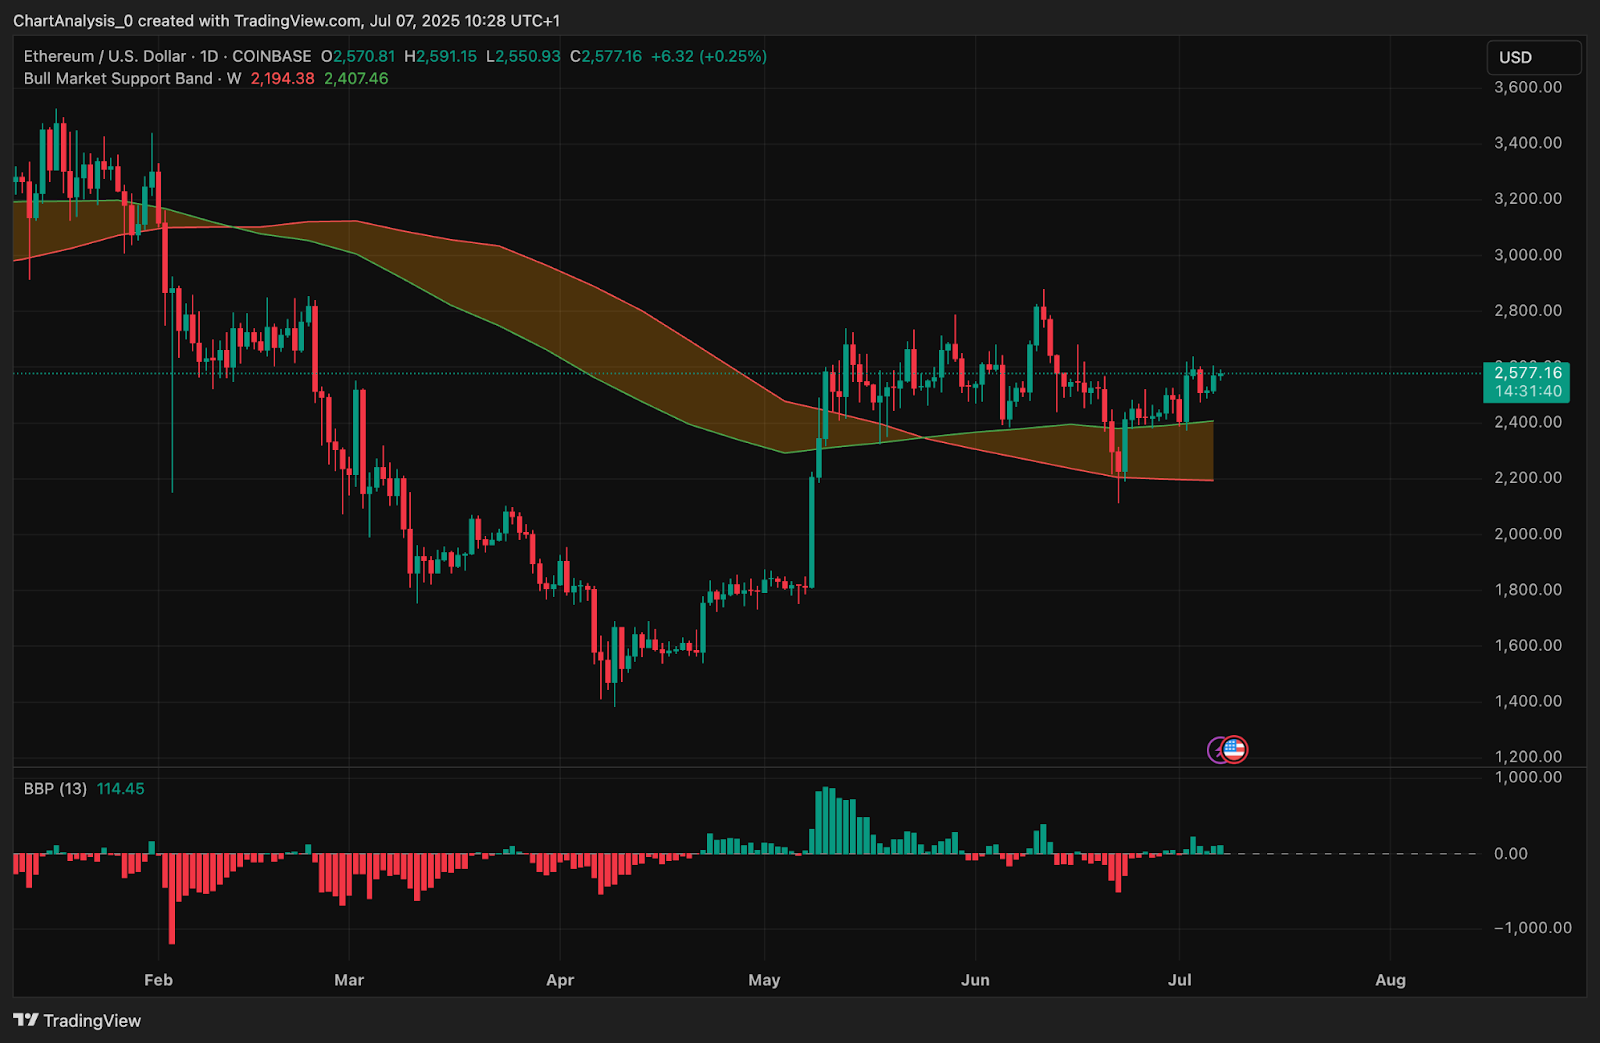
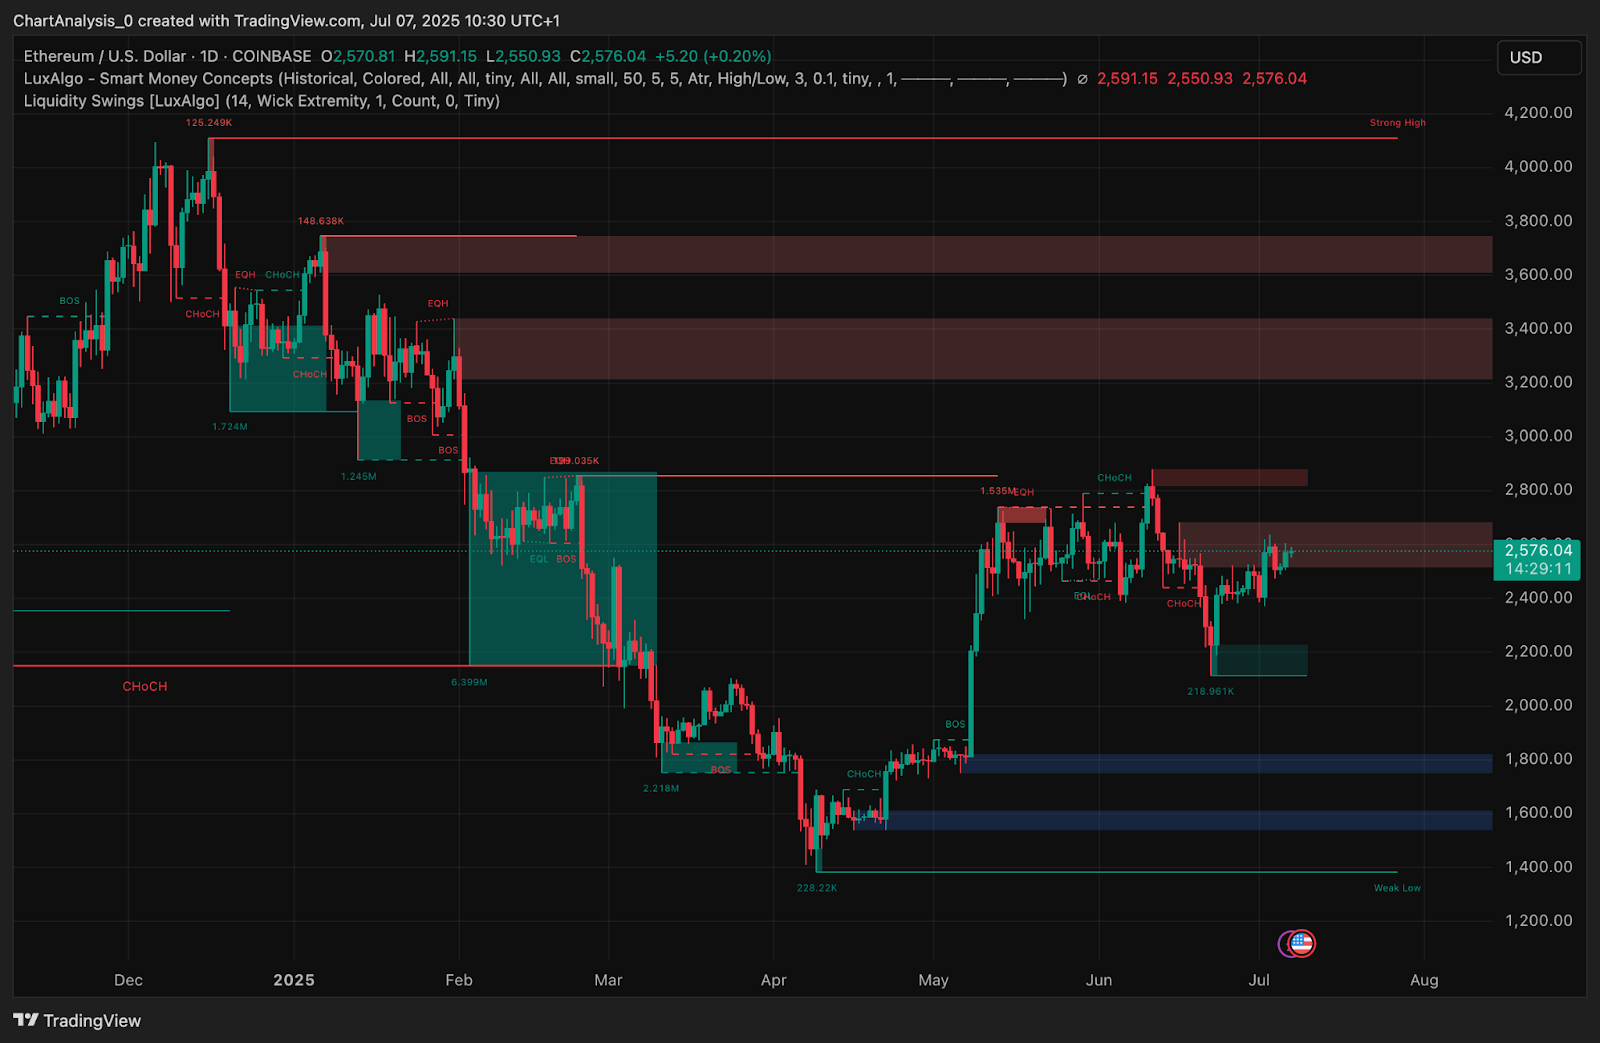
The daily chart highlights ETH consolidating above the Bull Market Support Band ($2,194–$2,407), which it reclaimed in June. This historically acts as a macro trend guide, and price holding above it adds confidence to the current bullish setup.
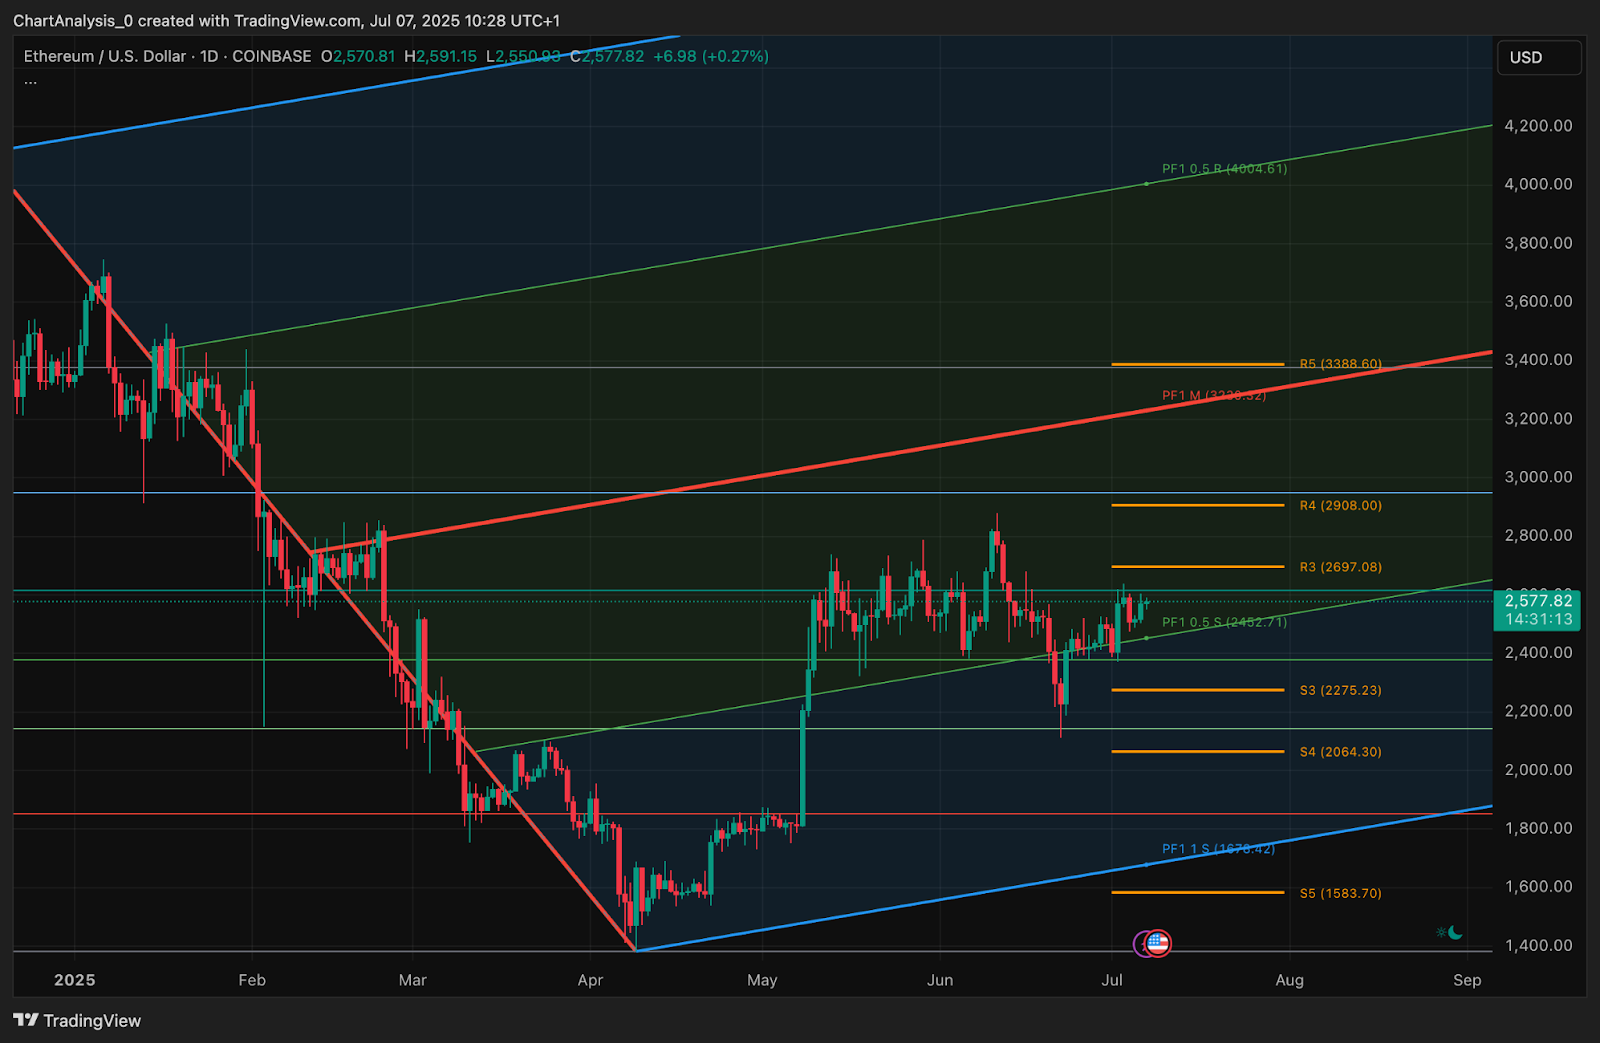
Meanwhile, Fibonacci pivot levels on the daily chart show ETH trading near PF1 0.5 S support (~$2,582), within a rising channel. If this base holds, a move toward R3 ($2,697) and R4 ($2,908) becomes increasingly likely.
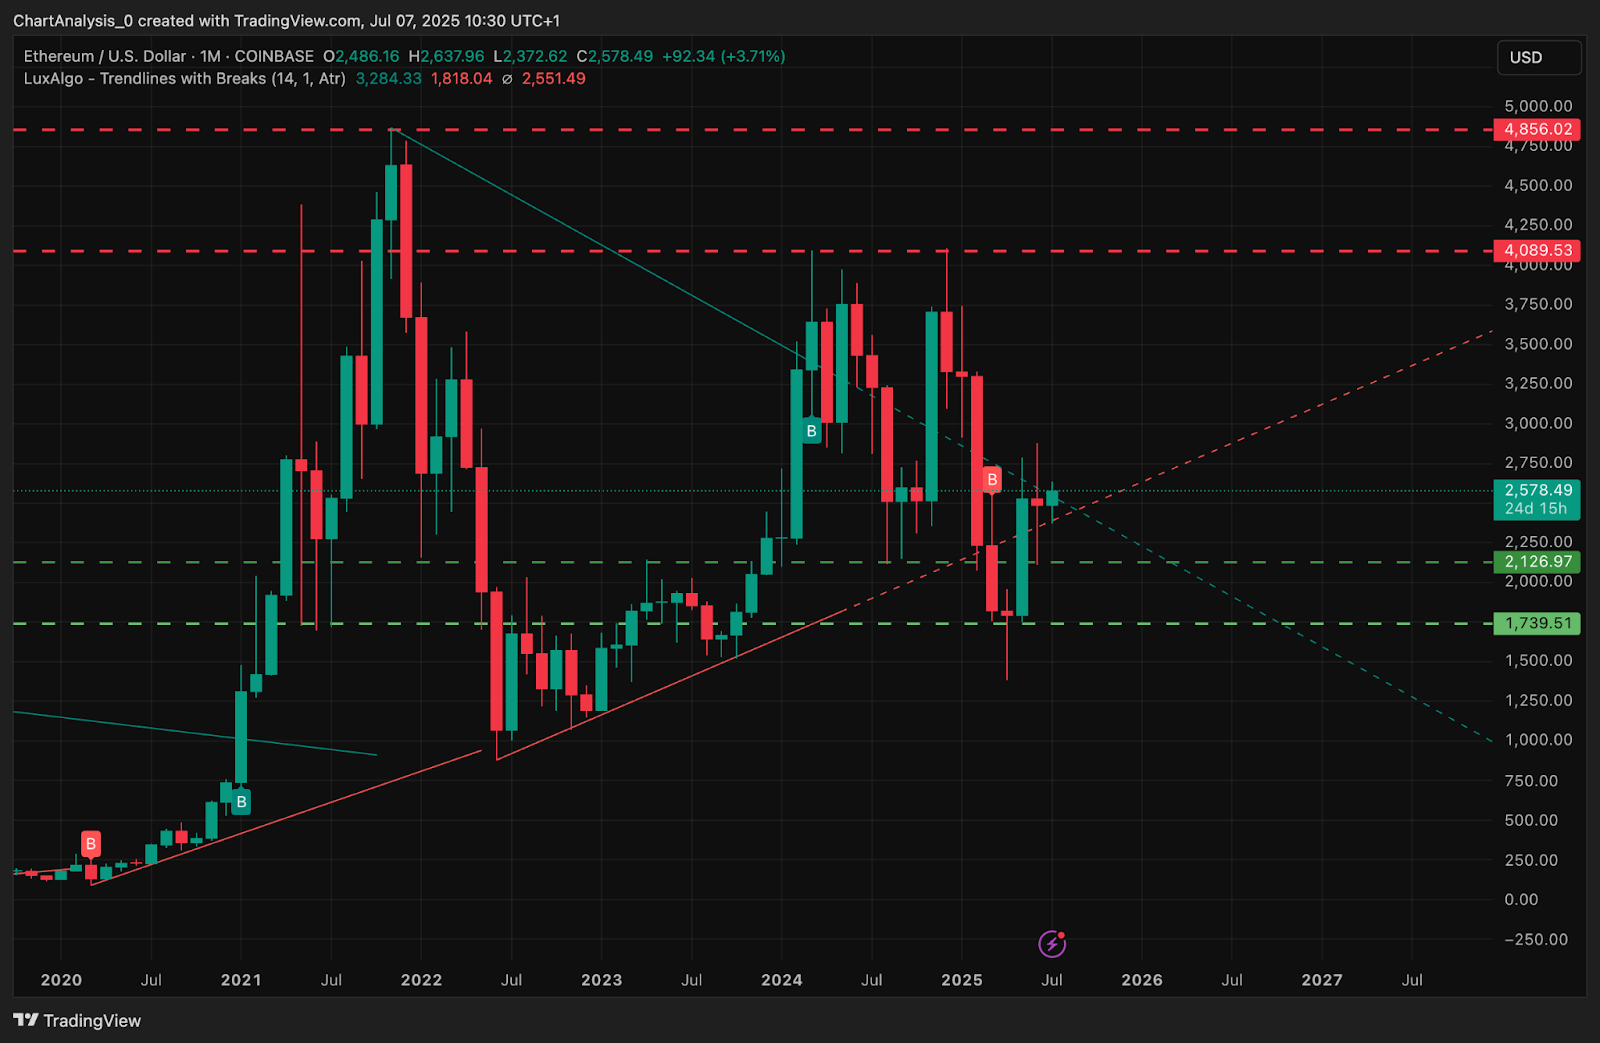
From a longer-term perspective, the monthly chart reveals ETH is battling a key intersection of trendlines near $2,550. A monthly close above this zone would confirm a macro breakout and unlock upside toward $3,284 and $4,089, the next major liquidity pockets.
ETH Price Prediction: Short-Term Outlook (24H)
Ethereum price is now entering a squeeze zone between $2,565 and $2,595, with several intraday wicks attempting to break higher. A successful breakout with volume above $2,600 could open the door toward $2,697 (R3) and $2,745, where prior supply remains thick.
On the downside, failure to hold $2,560 may prompt a retest of the EMA cluster around $2,540 and $2,514. Below that, a deeper pullback could target the $2,475–$2,500 support zone, which aligns with prior VWAP levels and mid-Bollinger support.
Given the tightening range, bullish derivatives bias, and macro support reclaim, ETH appears to be coiling for a move. Traders should watch for volume expansion and a breakout above the $2,600 level to confirm continuation.
Ethereum Price Forecast Table: July 8, 2025
| Indicator/Zone | Level / Signal |
| Ethereum price today | $2,577 |
| Resistance 1 | $2,600 |
| Resistance 2 | $2,697 (Fibonacci R3) |
| Support 1 | $2,565 (VWAP/SAR support) |
| Support 2 | $2,514 (EMA cluster zone) |
| RSI (30-min) | 56.2 (mild bullish) |
| MACD (30-min) | Neutral crossover |
| Bollinger Bands (4H) | Expanding, mid-band support |
| EMAs (20/50/100/200, 4H) | Bullishly aligned below price |
| SMC Structure | CHoCH/BOS held above $2,540 |
| Derivatives Volume | +128%, Long-dominant bias |
| Bull Market Support Band (1D) | Held above $2,407 |
Disclaimer: The information presented in this article is for informational and educational purposes only. The article does not constitute financial advice or advice of any kind. Coin Edition is not responsible for any losses incurred as a result of the utilization of content, products, or services mentioned. Readers are advised to exercise caution before taking any action related to the company.