Ethereum (ETH) price has been trading in a tight range around $2,500, leaving traders and investors wondering: is the next move up or down? By analyzing the daily chart, key resistance levels, and RSI signals, we can uncover likely ETH price targets and potential breakout triggers.
Ethereum Price Prediction: Current Trend and Key Levels
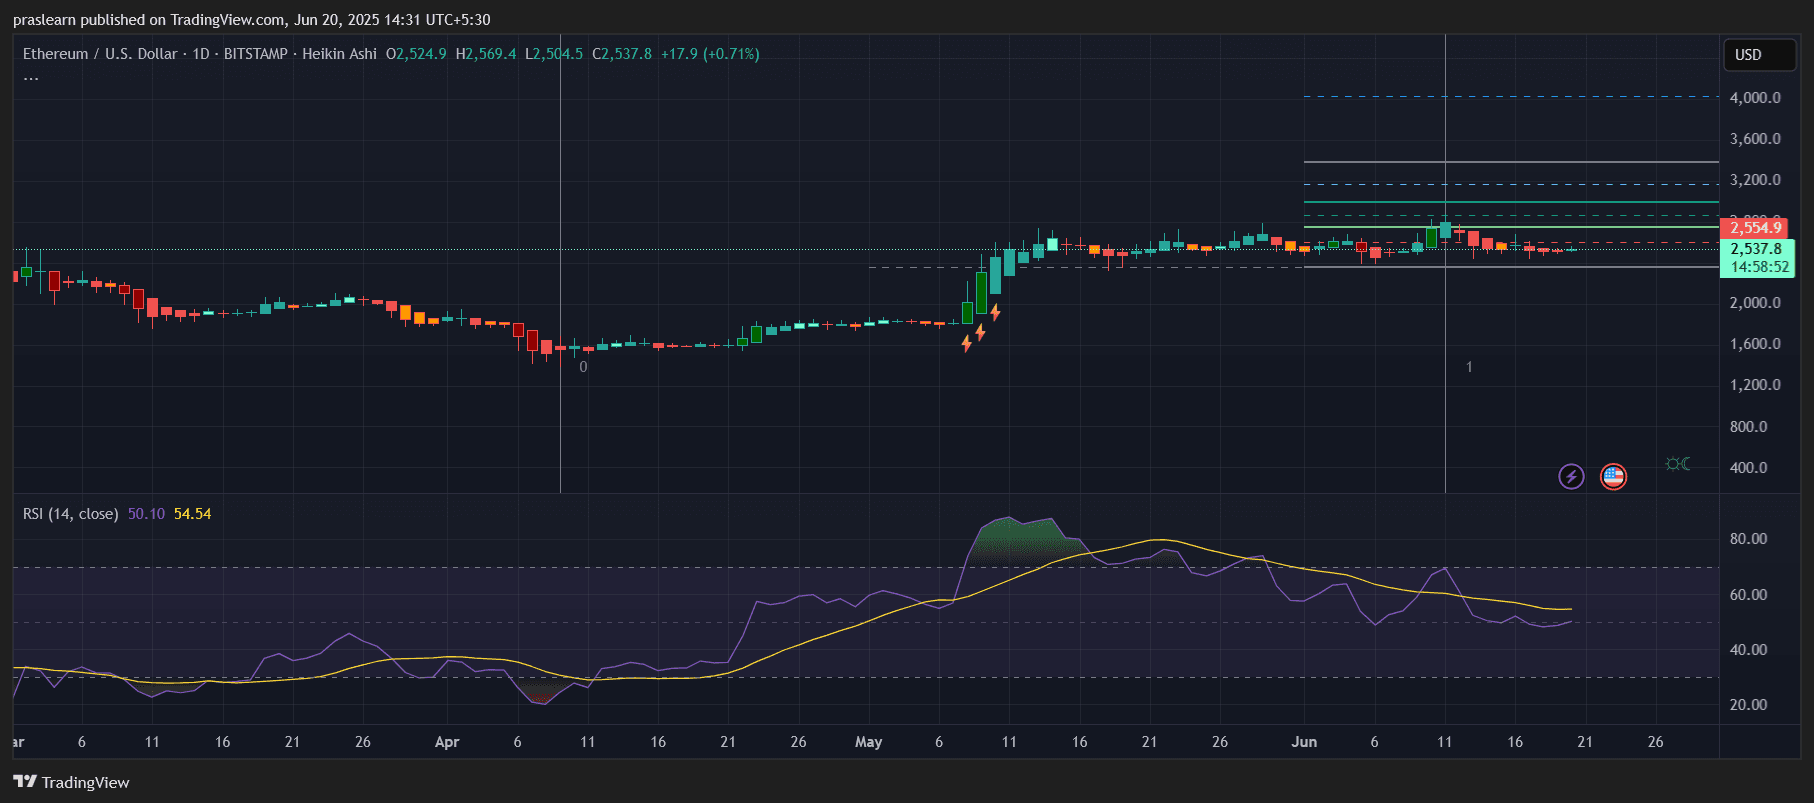
As of June 20, 2025, Ethereum price is trading at $2,537.80, slightly up by 0.71% on the day. It has been consolidating for several weeks after its sharp rally in early May.
- Key support: $2,420
- Immediate resistance: $2,554 (near today’s high)
- Major resistance zones: $2,800, $3,200, and $3,600
- Psychological level: $3,000
This horizontal movement of Ethereum price with small-bodied candles in a narrow range reflects indecision in the market, but compression often precedes expansion. The Heikin Ashi candles also show a lack of strong directional bias.
RSI Is Flat, But Here's Why That Matters
The Relative Strength Index (RSI) is currently at 54.54, just above the neutral 50 mark. While not in overbought territory, the RSI has been trending downward since mid-May. This typically signals a cooling-off period or consolidation before the next big move. If RSI climbs above 60 and the price breaks $2,600 with volume, it could trigger a Ethereum price short-term rally toward $2,800.
Fibonacci Projections Say $3,200–$3,600 Is in Sight
Using the recent swing low at $2,000 and the swing high around $2,950, we apply Fibonacci extension levels:
- 1.0 (100%) extension: ~$2,950 (already tested and rejected)
- 1.618 extension: ~$3,600 — this is a strong long-term target
- 0.618 retracement support: ~$2,420 — current floor
If ETH price breaks above $2,950 convincingly, a move toward $3,600 (the 1.618 Fib level) becomes very realistic.
ETH Price Action: Accumulation Before the Explosion?
ETH’s price action is forming a bullish consolidation pattern, with tight candles following a strong impulse move. This often acts as a base for the next leg up. The current sideways movement mirrors accumulation phases seen historically before breakouts.
Volume has also remained low during the consolidation — another signal of a pending volatility spike.
Ethereum Price Prediction: What Happens If ETH Repeats May’s Rally?
In early May, ETH price rallied from $2,000 to nearly $3,000 — a 50% increase in about 15 days.
If Ethereum price replicates that move from the current base of ~$2,500: $2,500 + (50% of $2,500) = $3,750. This aligns well with the Fibonacci 1.618 extension zone and could act as a mid-term top.
ETH Likely to Hit $3,200–$3,600 in the Next 30 Days?
Unless macroeconomic or crypto-specific sentiment drastically shifts, Ethereum price seems poised to retest $2,950 and then potentially surge toward $3,200 and $3,600. The RSI, tight price action, and previous rally structure support this thesis. However, failure to hold $2,420 would invalidate the bullish setup and may send ETH back to $2,200 or lower.
Final Thoughts
Ethereum price is coiling for a major move, and the chart suggests it could be a bullish breakout. Traders should closely watch the $2,550–$2,600 range. A clean break above could offer a high-probability long setup, especially if confirmed with RSI momentum and volume. Stay alert. ETH might not stay calm for long.
$ETH, $Ethereum