The Ethereum price today is trading around $2,518, reflecting a mild intraday loss of 0.34% as bulls and bears continue a tug-of-war just below the $2,540–$2,570 resistance band.
Despite several recent Ethereum price spikes above $2,600, each rally has been met with strong rejection from the upper Bollinger Band and supply zones near $2,660. The broader trend remains neutral-bearish as ETH fails to reclaim momentum.
What’s Happening With Ethereum’s Price?
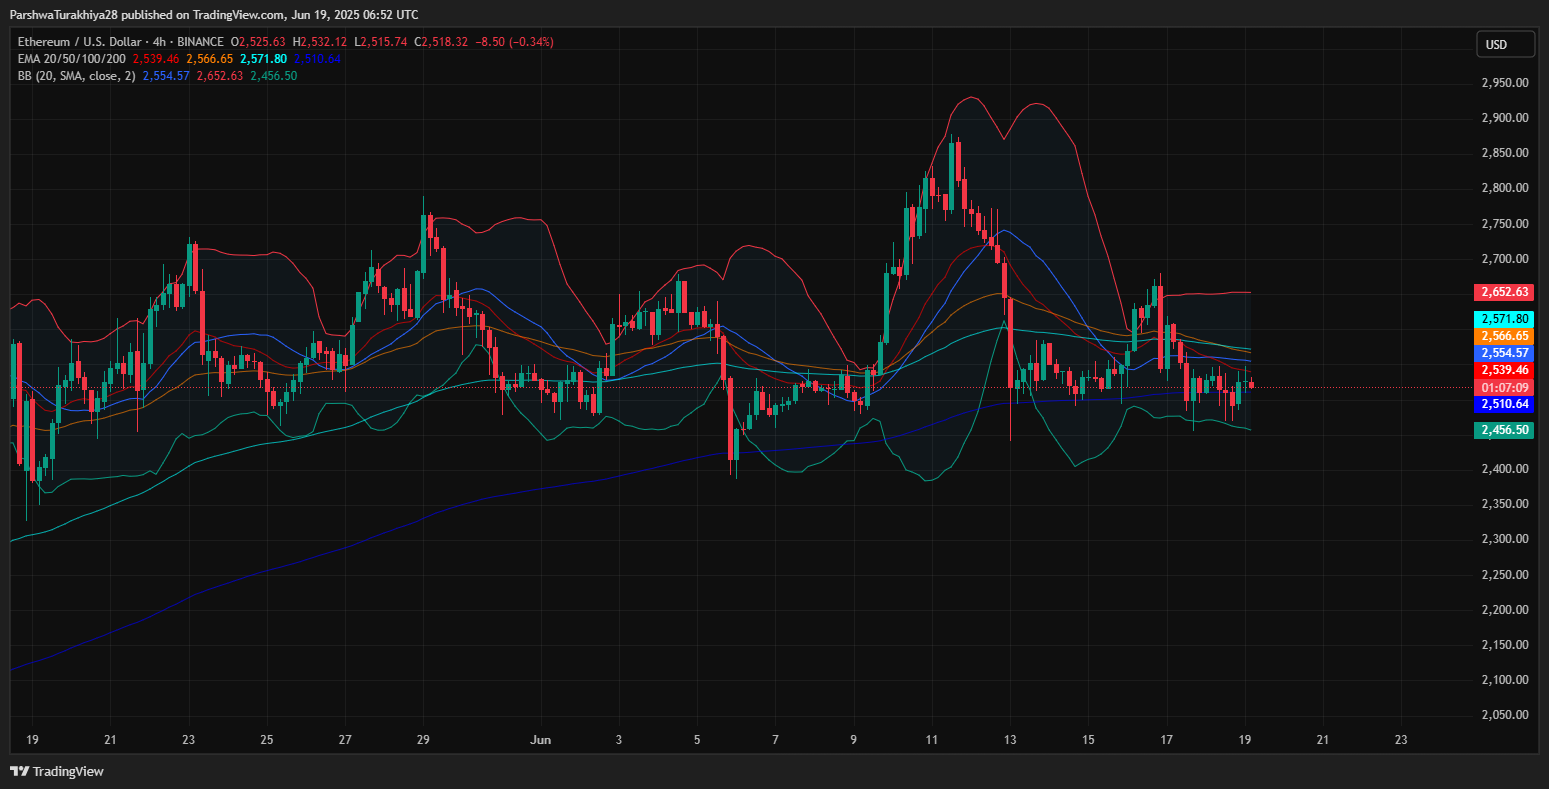
ETH is currently trading inside a tight compression zone between $2,510 and $2,540, where multiple dynamic indicators intersect. The 4-hour chart shows price caught between the 50 EMA ($2,539) and 100 EMA ($2,566), while the lower Bollinger Band sits near $2,456, providing near-term support.
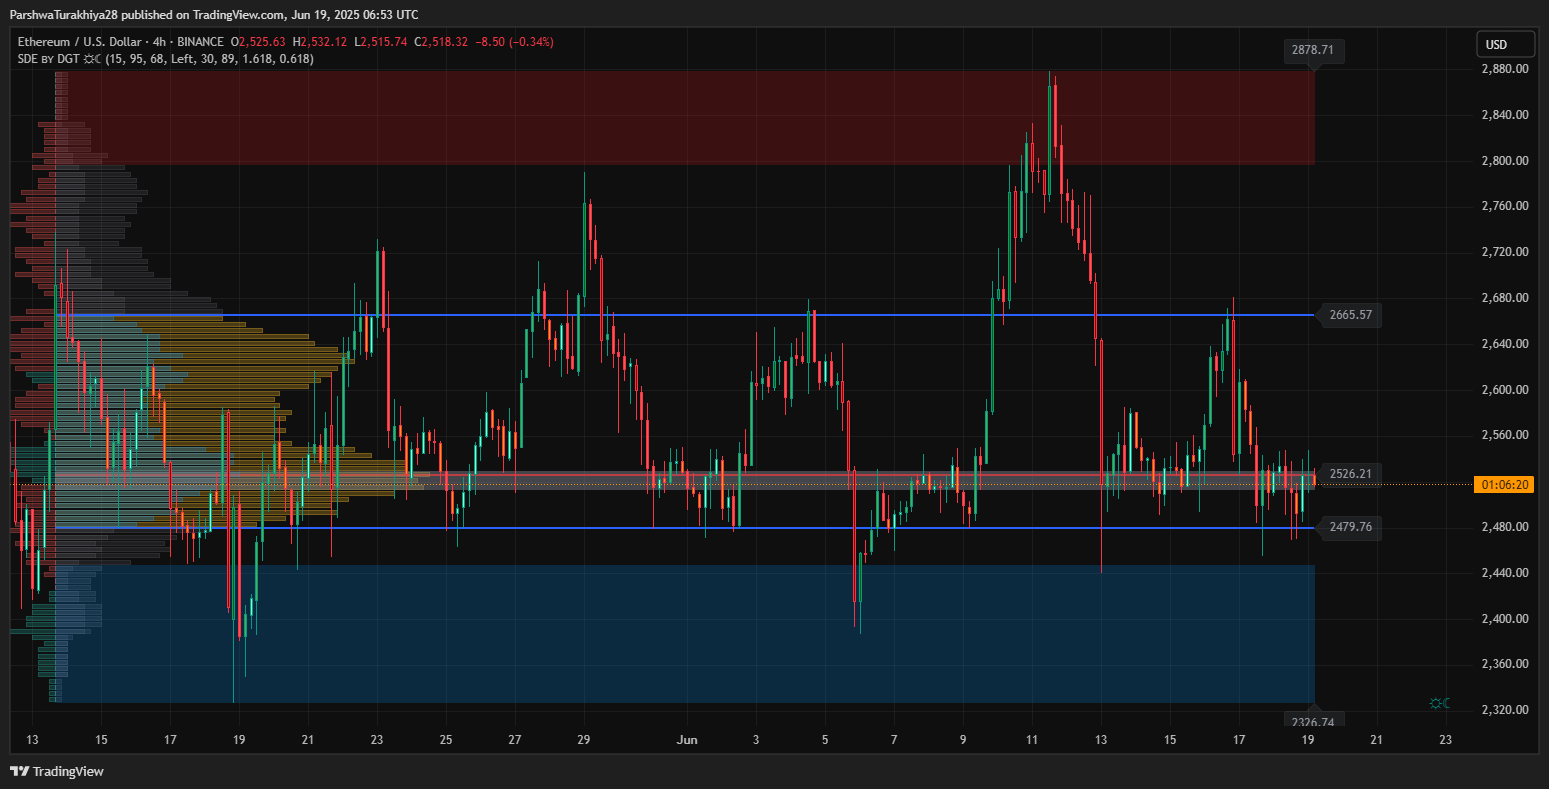
The volume profile shows a heavy node near $2,520, reinforcing this area as a high-traffic price zone. Meanwhile, liquidity mapping confirms that recent wicks below $2,480 were absorbed quickly, suggesting buyers are defending the lower boundary.
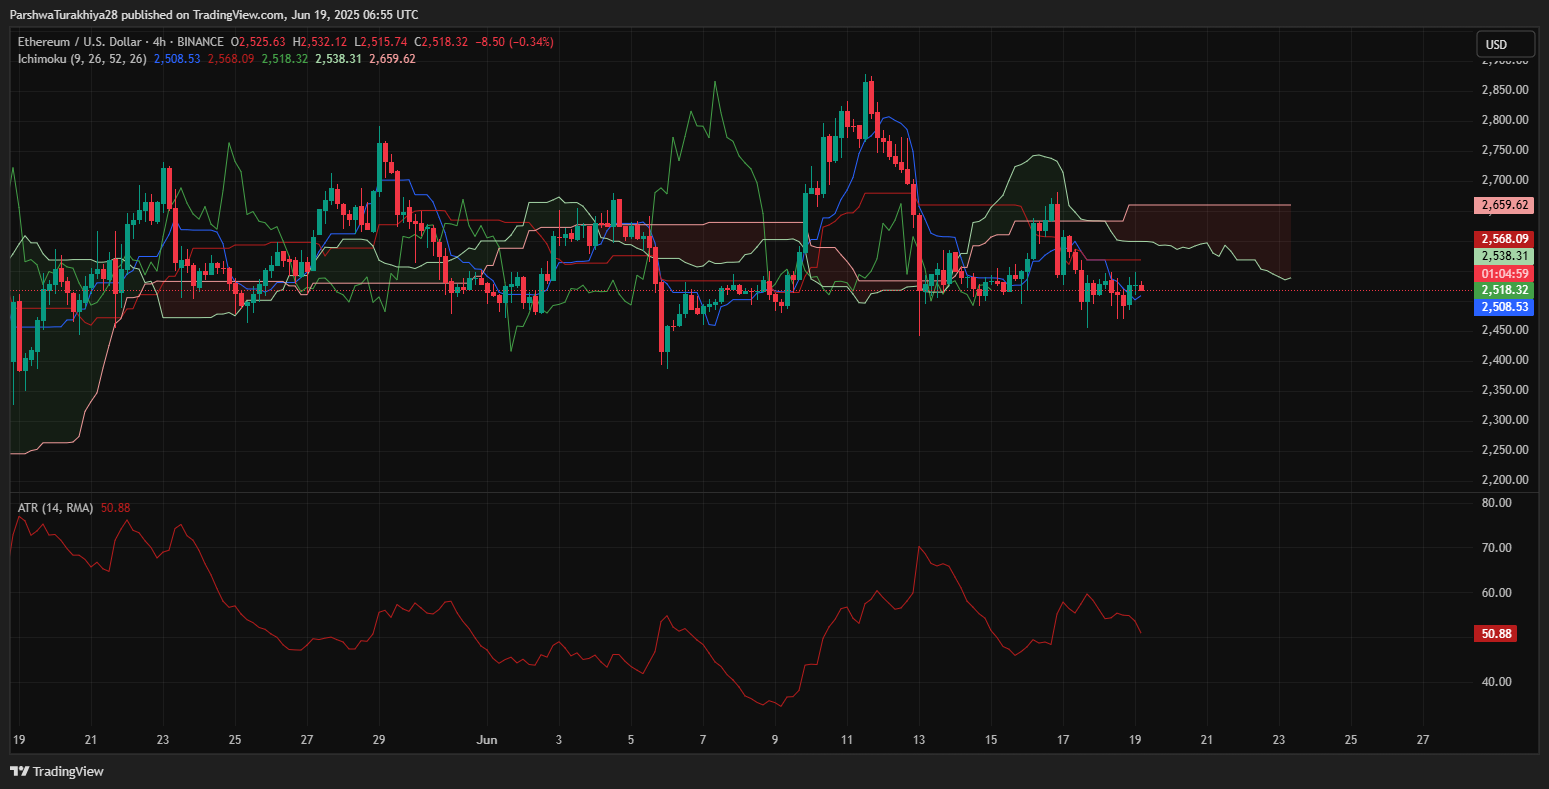
On the Ichimoku chart, ETH remains beneath the Kumo cloud with Tenkan-Sen and Kijun-Sen flat, signaling range-bound indecision. The 4-hour ATR (50.88) continues to contract, supporting the case for an imminent volatility breakout.
Why Ethereum Price Going Down Today?
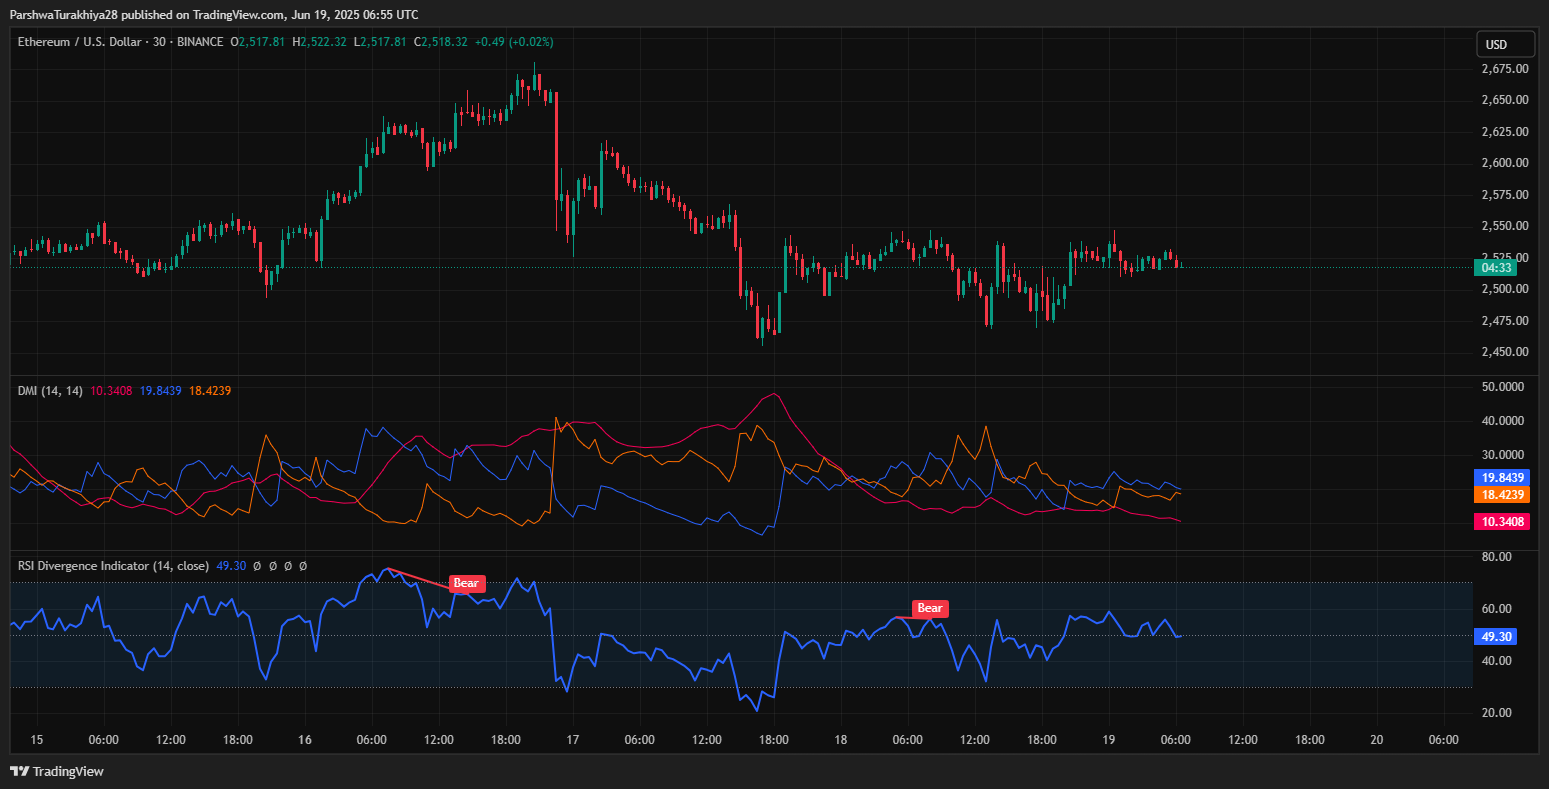
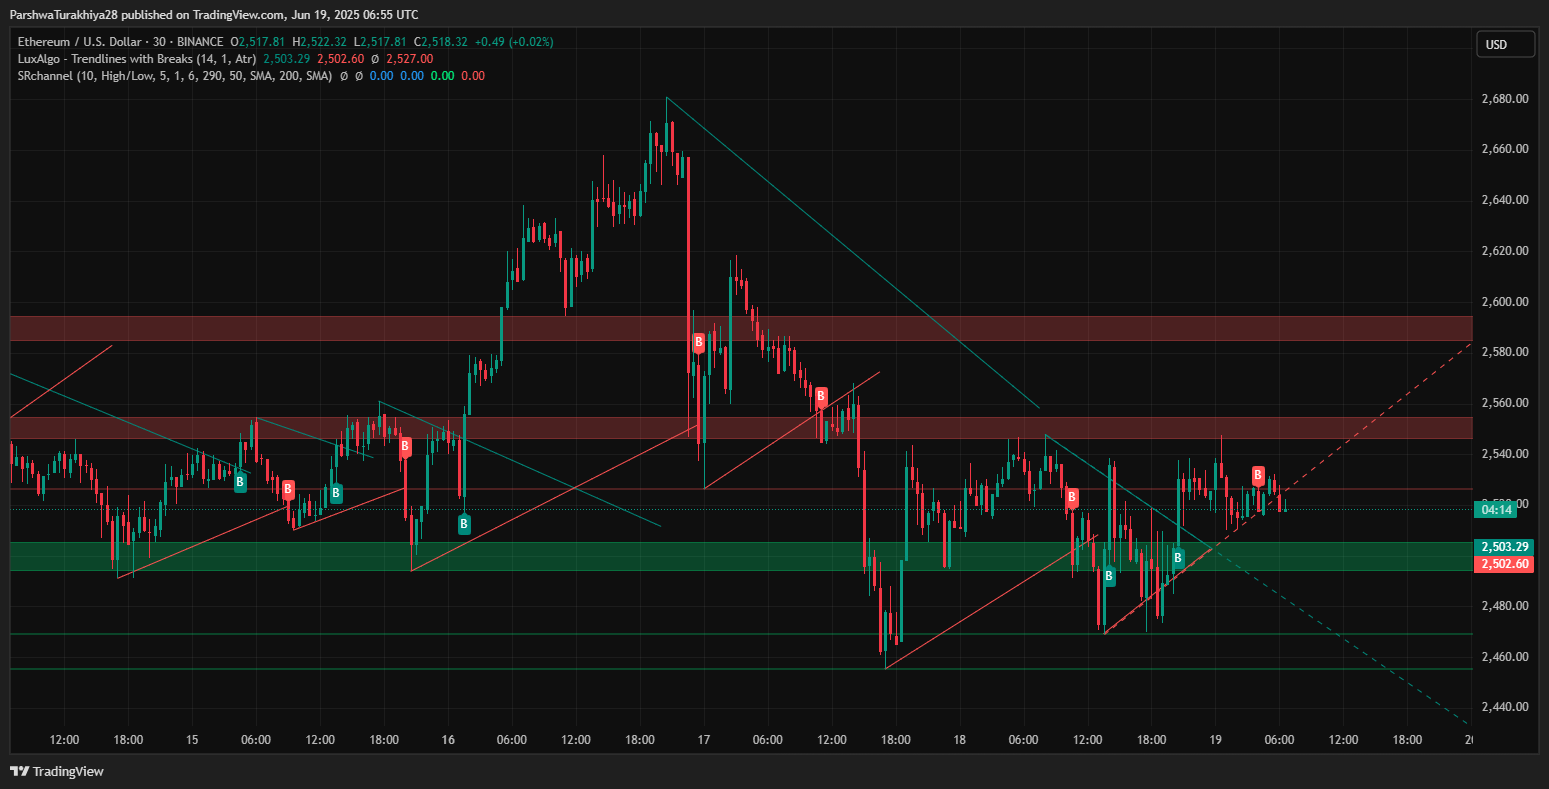
A look at the 30-minute timeframe highlights clear bearish divergence on the RSI, which sits around 49.30, just under neutral. MACD lines remain flat, lacking bullish crossover strength. The DMI shows weak trend momentum as the +DI and -DI lines converge, with ADX under 20, reflecting indecision.
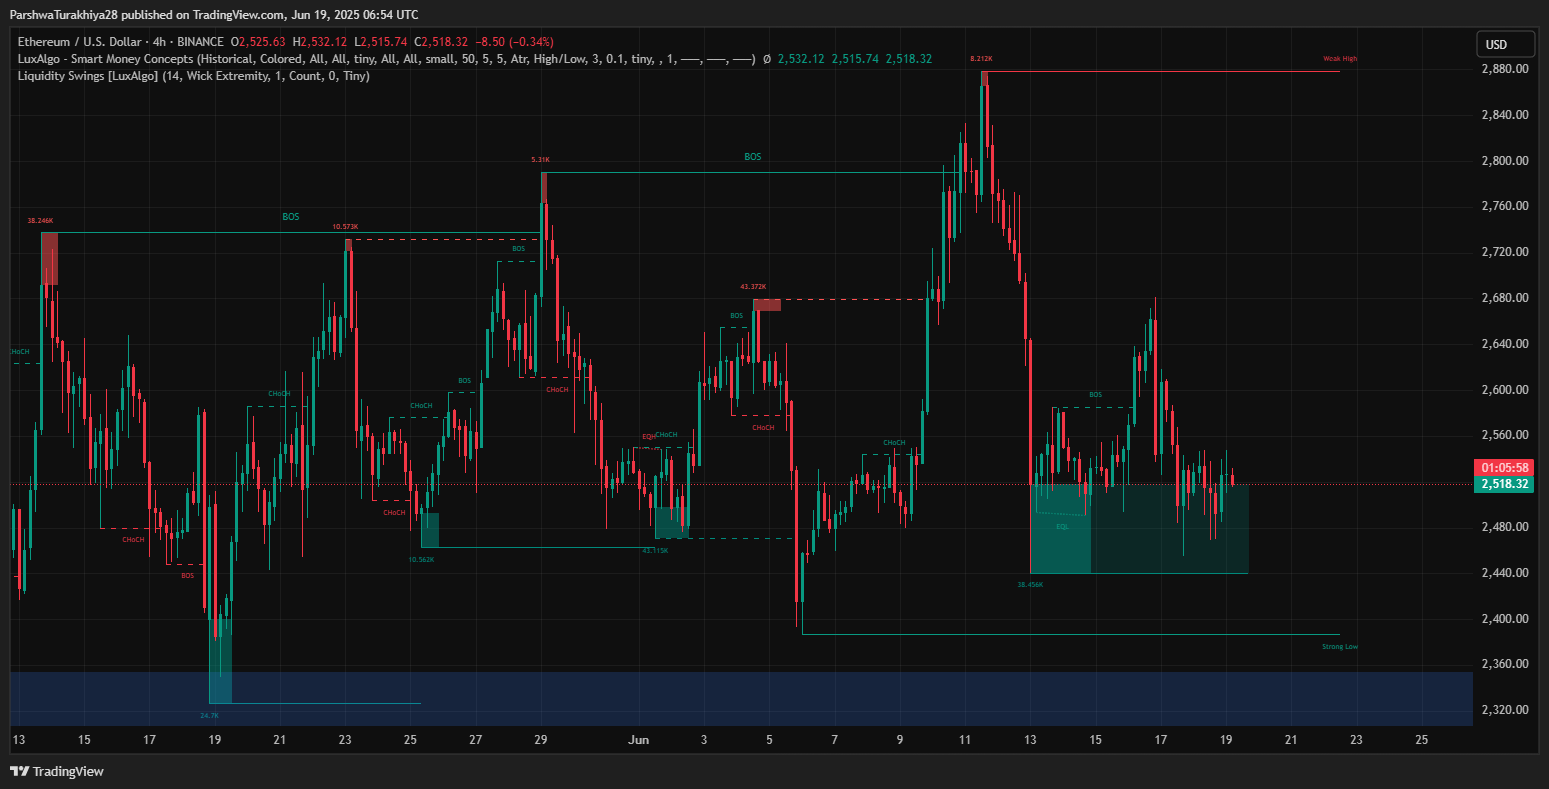
In addition, price failed to break through a key descending trendline near $2,540, marking the fifth lower high since June 12. These failed breakouts coupled with bearish liquidity reactions in Smart Money Concepts reflect why Ethereum price went down today despite consolidation efforts.
Short-Term Outlook: Breakout Imminent as ETH Tests Key Trendline
If ETH can reclaim the $2,540–$2,570 EMA resistance cluster with a clean candle close above the Bollinger midline and VWAP zone, bulls may target $2,600 initially, followed by $2,660 and $2,710.
However, failure to defend $2,510 and repeated rejections from the $2,540 zone could trigger a deeper retracement toward $2,480, followed by demand near $2,438. The worst-case dip lies around $2,336, where high-volume demand meets the 1.618 pitchfork extension from the broader trendline.
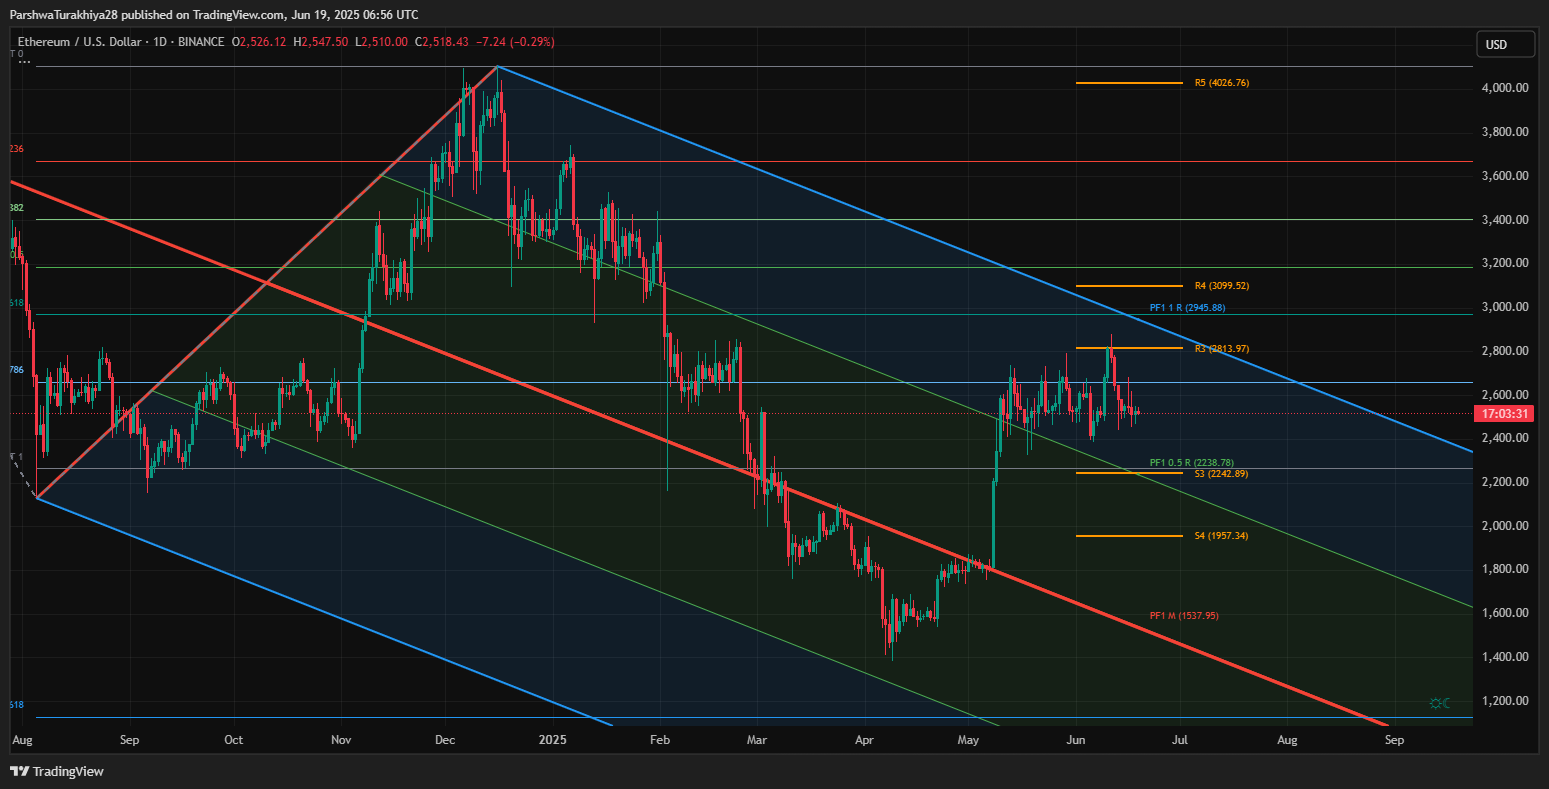
From a macro view, the daily chart still shows ETH respecting the lower boundary of a downward pitchfork structure and failing to reclaim the Fib 0.5 level. Unless price action reclaims $2,660+ with conviction, upside momentum remains capped.
Ethereum Price Forecast Table: June 20, 2025
| Indicator/Zone | Level (USD) | Signal |
| Resistance 1 (EMA Cluster) | 2,539–2,566 | Breakout threshold |
| Resistance 2 (Volume Zone) | 2,660 | Upper supply barrier |
| Resistance 3 (Trendline Top) | 2,710 | Bullish continuation target |
| Support 1 (VWAP Zone) | 2,510 | Near-term support |
| Support 2 (Demand Zone) | 2,438 | Breakdown risk |
| Support 3 (Pitchfork EXT) | 2,336 | Bearish scenario limit |
| 20/50/100/200 EMA Range | 2,510–2,571 | Convergence resistance |
| RSI (30-min) | 49.30 | Bearish divergence |
| MACD | Flat | Weak momentum |
| DMI/ADX | ADX < 20 | Low trend strength |
| ATR (4H) | 50.88 | Volatility squeeze |
| Ichimoku Cloud | Below Kumo | Trend indecision |
Disclaimer: The information presented in this article is for informational and educational purposes only. The article does not constitute financial advice or advice of any kind. Coin Edition is not responsible for any losses incurred as a result of the utilization of content, products, or services mentioned. Readers are advised to exercise caution before taking any action related to the company.