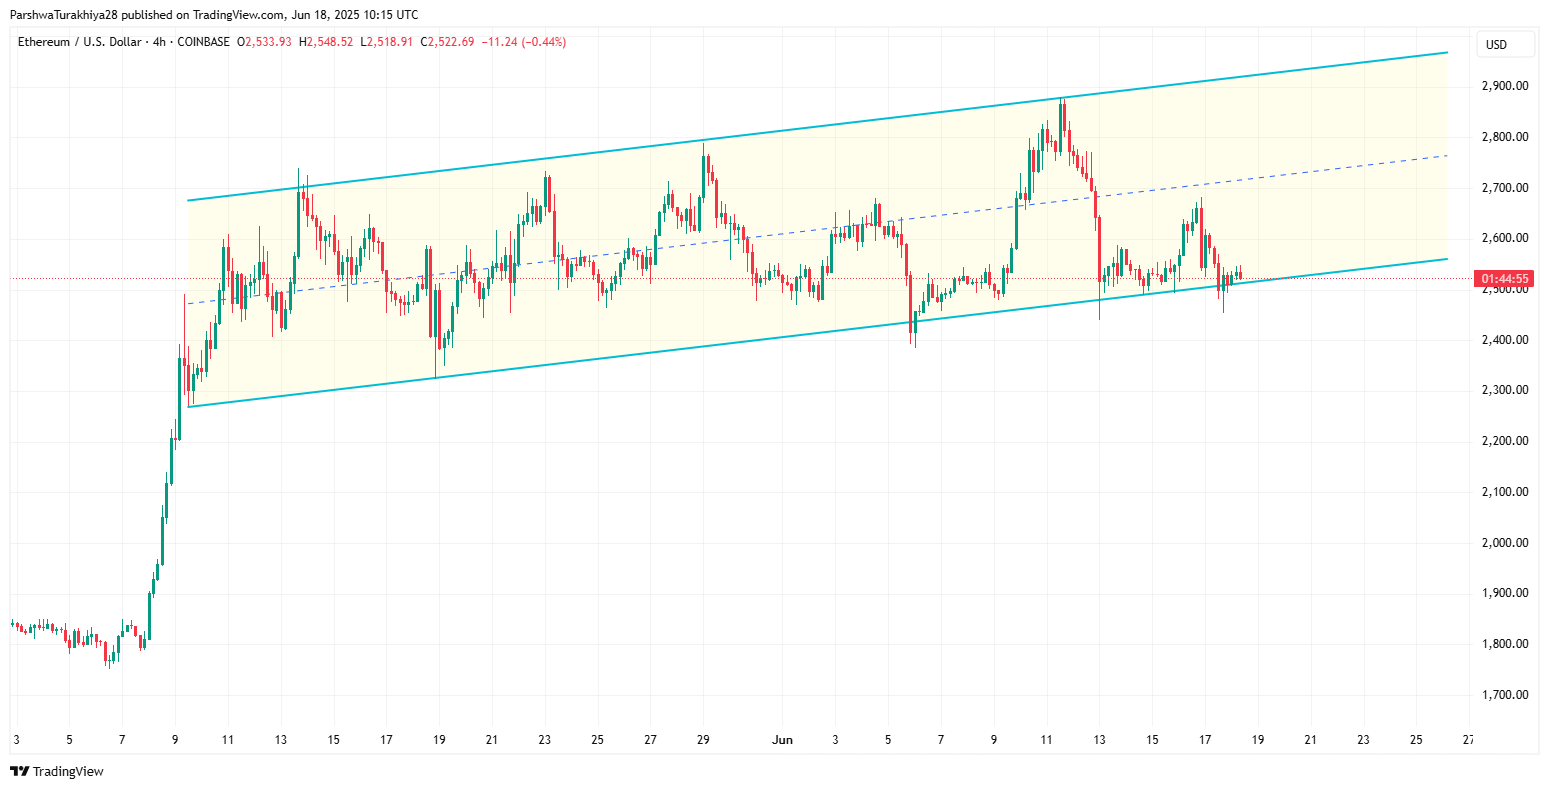
Ethereum is currently hovering around the $2,522 level after a mild drop of 0.4%, with the market showing mixed signals across multiple timeframes. The price structure has continued to consolidate within a wide parallel channel that started forming in late May, while indicators across momentum, volume, and volatility suggest a critical inflection point for the Ethereum price today.
ETH Price: Smart Money Zones And Trend Channels Signal Mid-Zone Balance
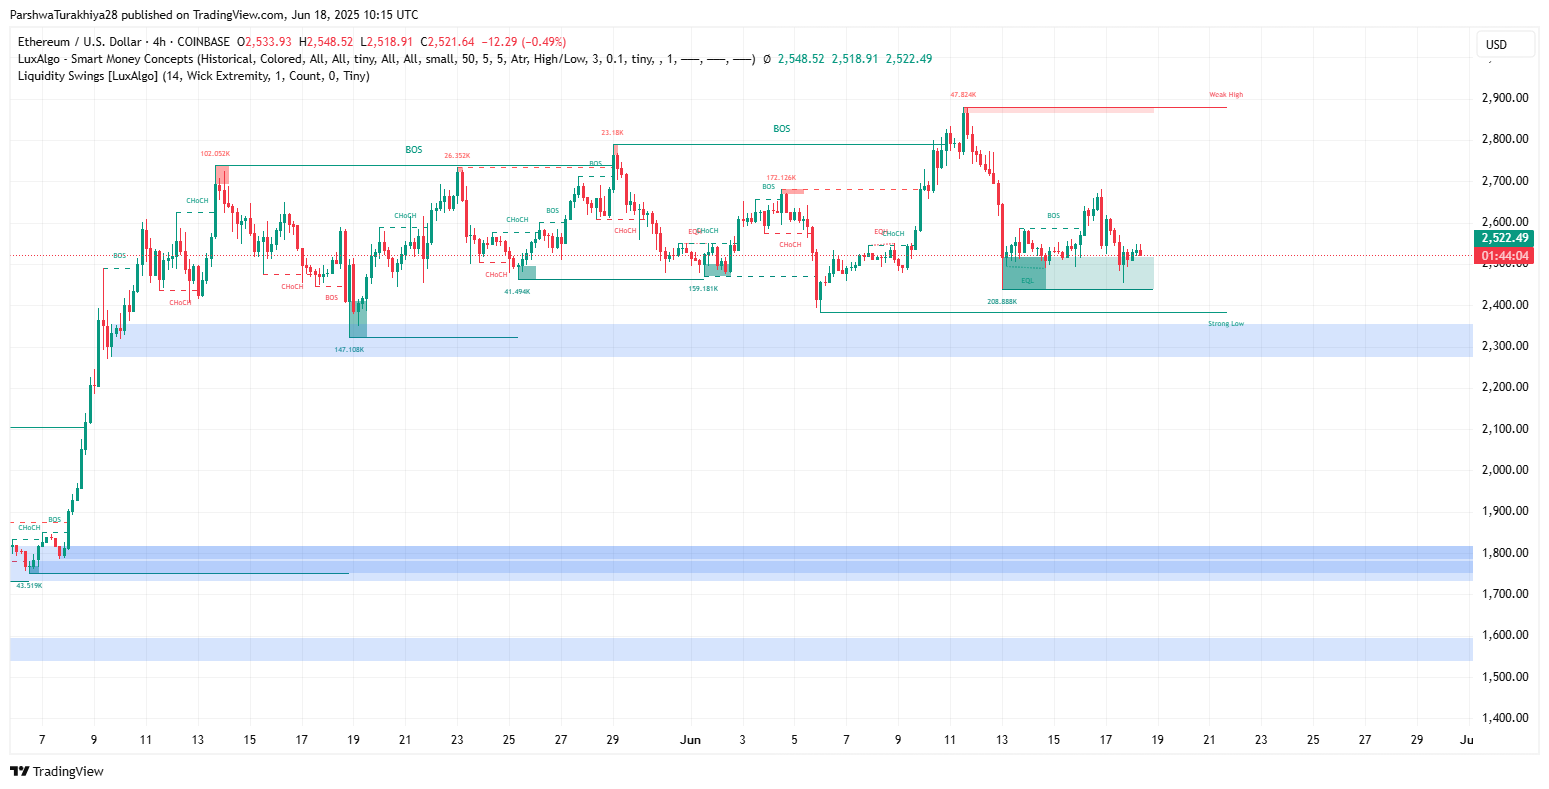
Looking at the 4-hour chart, Ethereum price is stuck between a key supply zone near $2,650 and demand around $2,420. The Smart Money Concepts (SMC) indicators show recent Breaks of Structure (BOS) at $2,518 and earlier at $2,622, highlighting that institutional accumulation might be occurring near the mid-levels of this range. A bearish CHoCH and liquidity grab also indicate sell-side liquidity is being swept before a potential reversal.
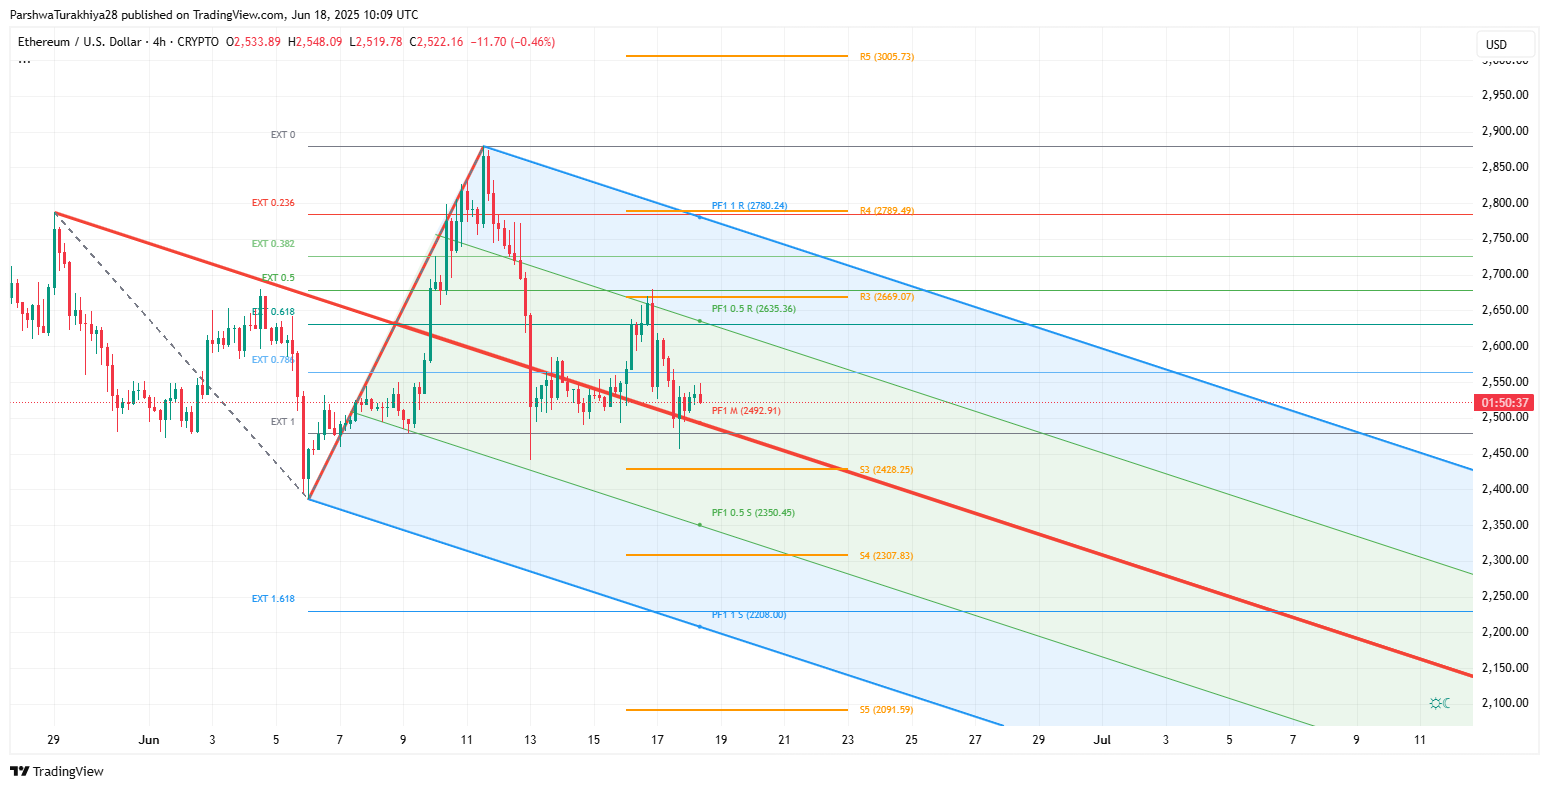
Simultaneously, Ethereum is moving inside a descending pitchfork with resistance near $2,635 and median support around $2,430. This places the Ethereum price action squarely inside a high-volume, low-conviction zone with no clear breakout just yet.
Ethereum Price: Volume And Momentum Tools Suggest Caution
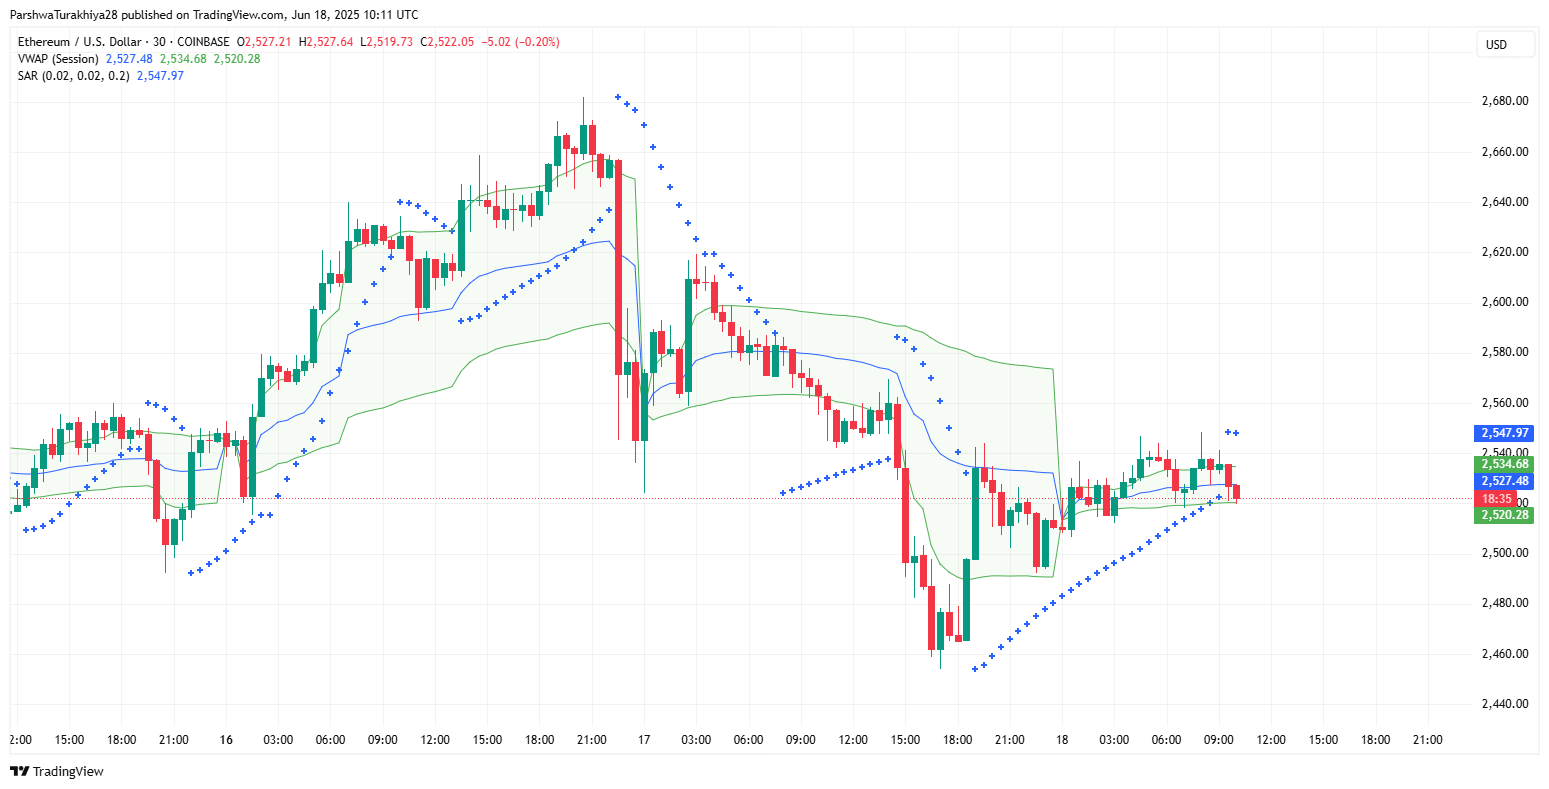
The VWAP and Parabolic SAR on the 30-minute chart reveal a stalling bullish bias. While price hovers slightly above the VWAP line near $2,520, the SAR dots are beginning to flip lower after tracking underneath for over 24 hours. This implies weakening trend momentum and a potential test of intraday support at $2,500.
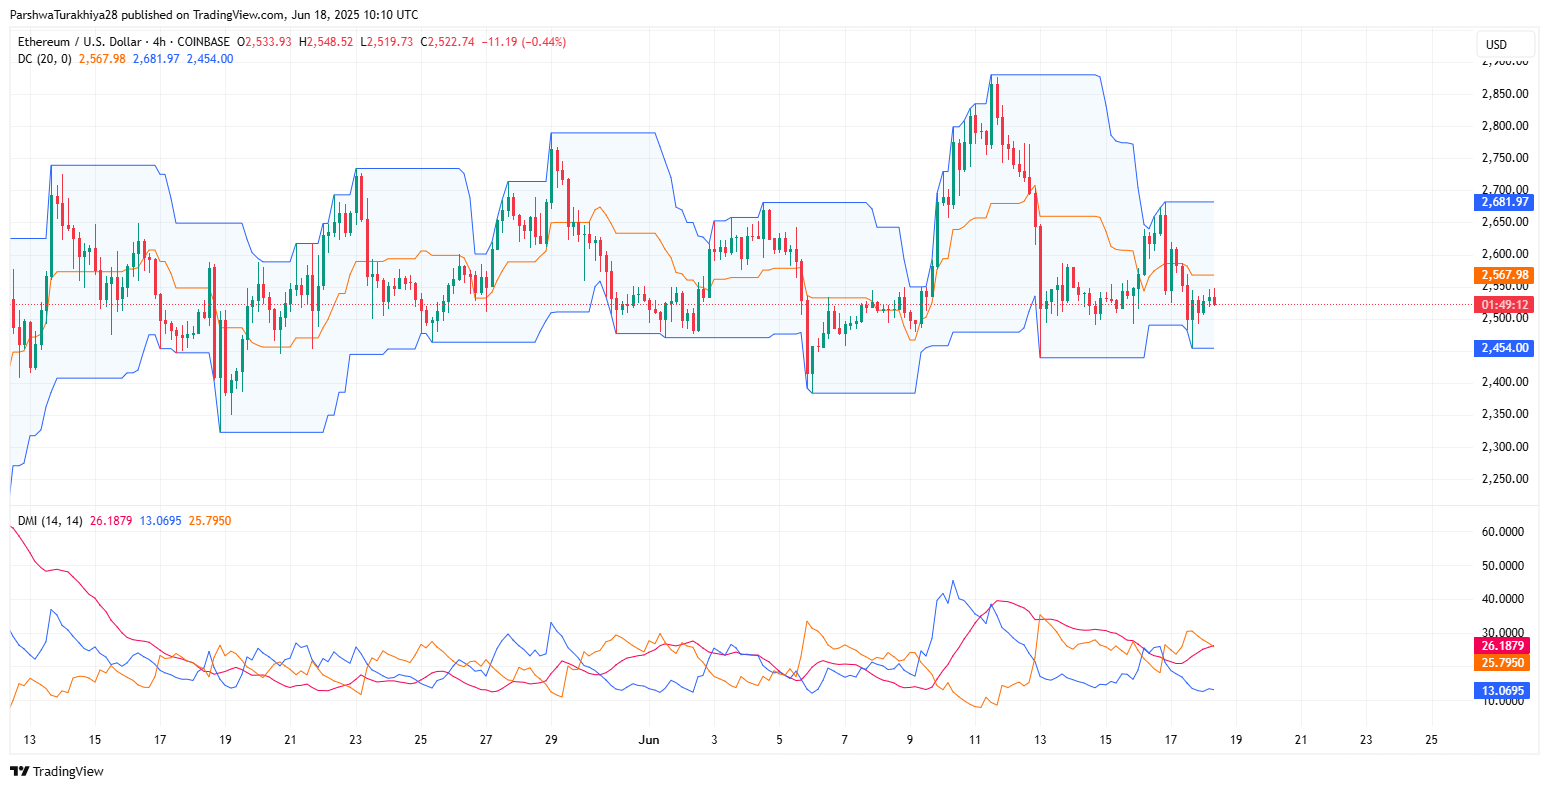
Looking at the Donchian Channel and DMI, the ADX sits near 26—suggesting moderate trend strength—with the +DI and -DI nearly intersecting. This illustrates a classic no-man’s-land scenario for Ethereum traders.
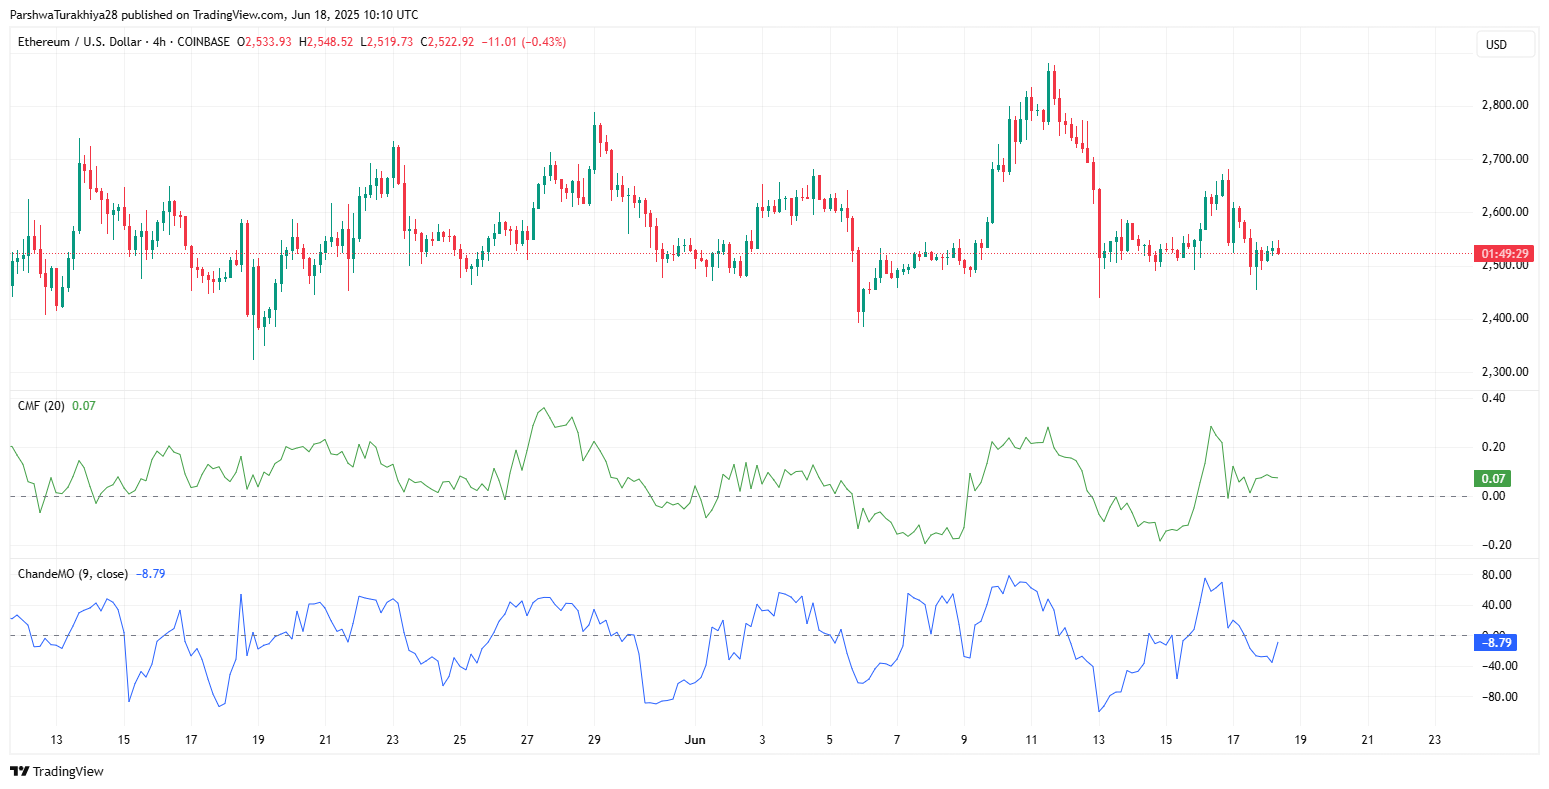
Additionally, the Chande Momentum Oscillator at -8.79 and the BBP showing neutral bars also reflect waning momentum. This confirms that despite recent Ethereum price spikes, there’s a lack of bullish follow-through.
Ethereum Price: Higher Timeframe Pressure Builds Below Key Fibs
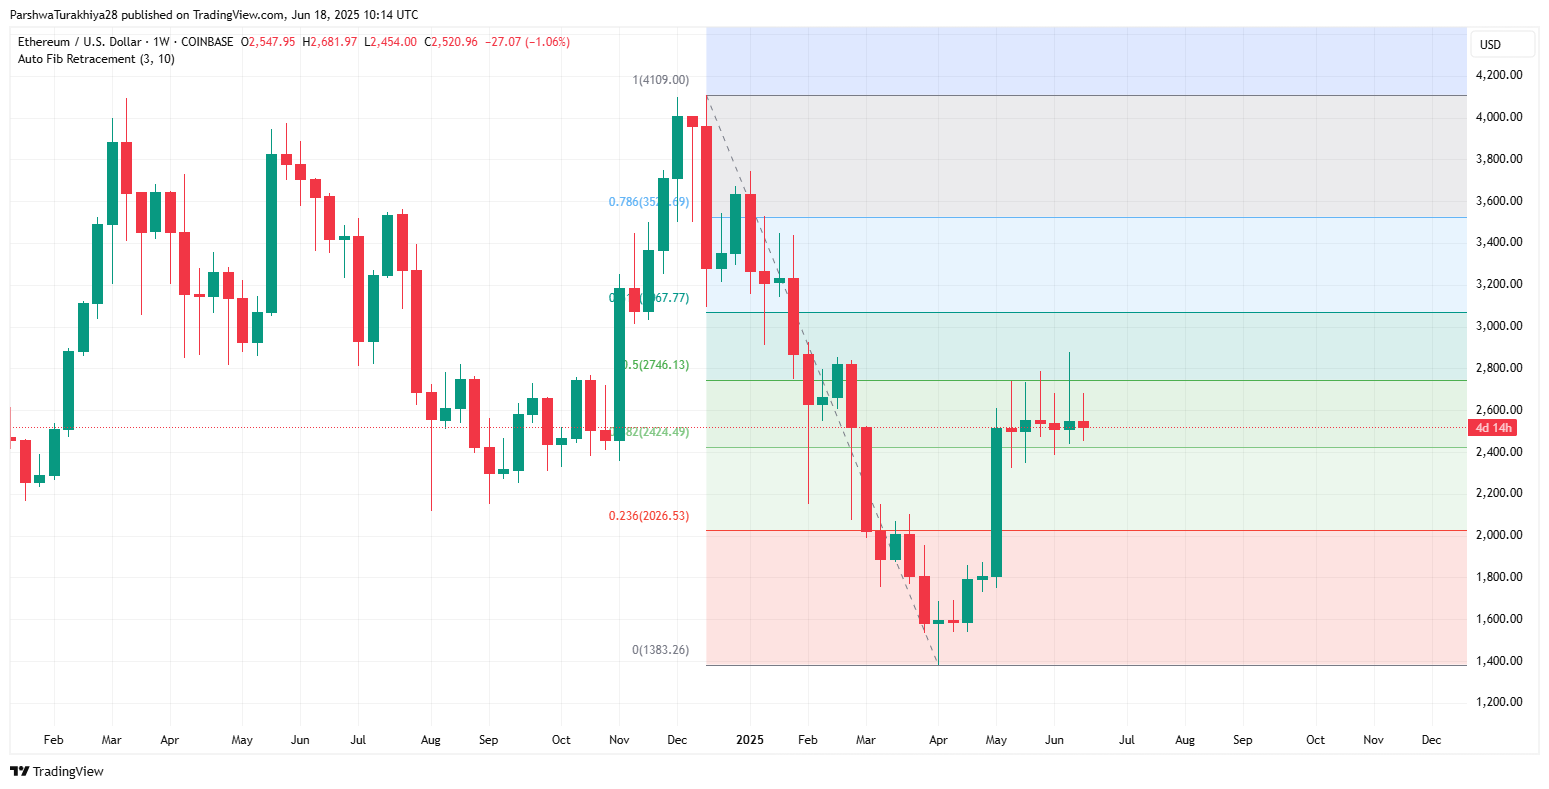
Zooming out to the weekly chart, Ethereum is struggling below the 0.618 Fibonacci level at $2,746, with lower highs forming beneath resistance.
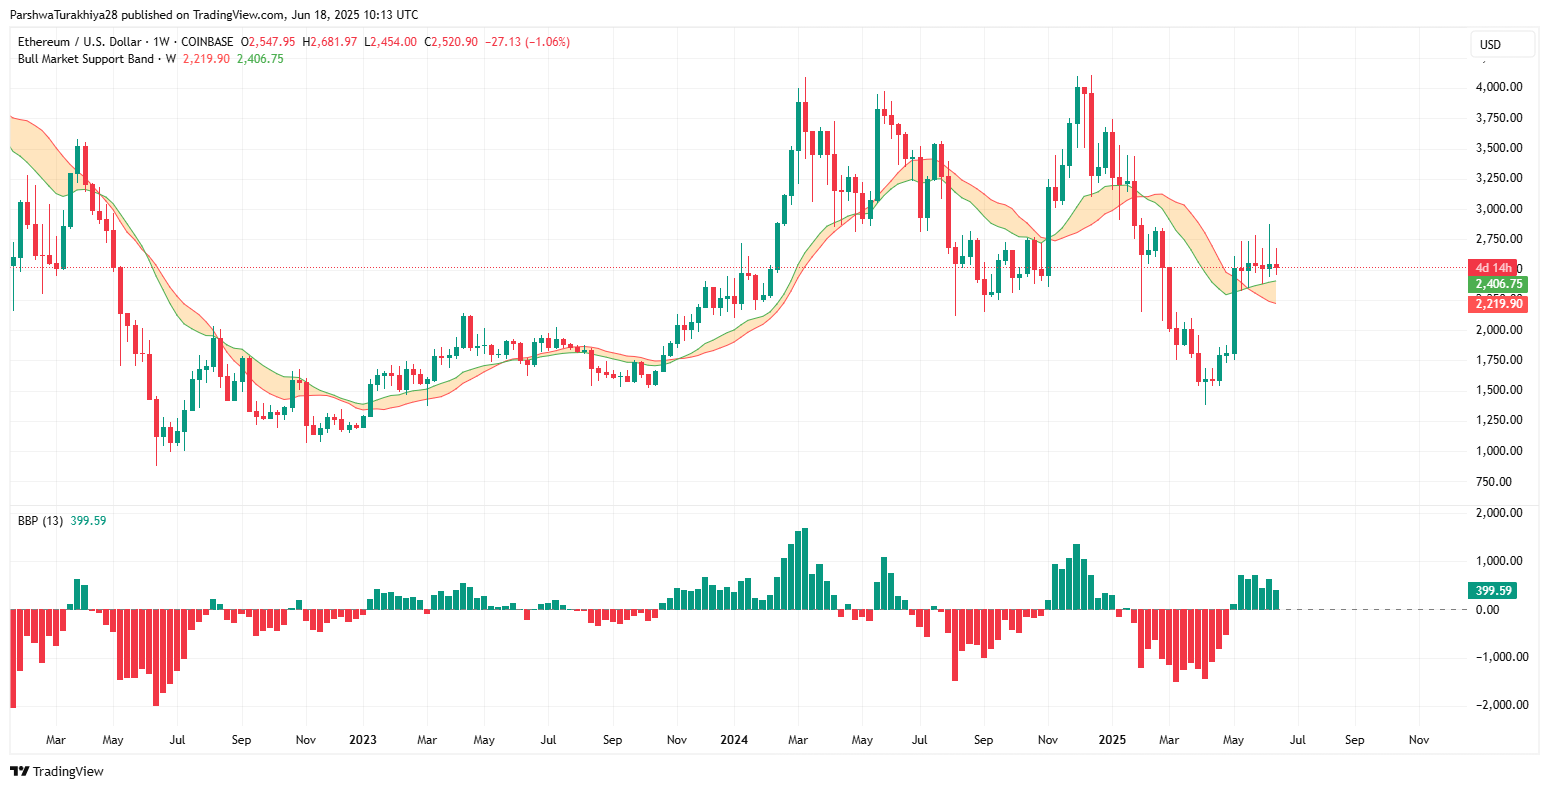
The Bull Market Support Band sits between $2,219 and $2,406. Notably, the Ethereum price has found short-term footing above the upper bound of this band, suggesting it remains in macro accumulation despite short-term dips.
Weekly BBP values remain significantly positive at 399.59, hinting that broader trend pressure remains bullish even as immediate momentum stalls.
Why Ethereum Price Going Down Today
The primary reason why Ethereum price going down today stems from a rejection near the $2,600 level after multiple failed breakouts. The price is also responding to overextended bullish divergence signals on both RSI and CMF that are now fading. Traders are also closely watching the $2,428 and $2,400 support levels, where a decisive break could lead to accelerated Ethereum price volatility toward the $2,300–$2,200 range.
Furthermore, capital inflow has dried up as shown by the CMF hovering barely above 0.00, implying low conviction behind recent price bounces. This aligns with profit-taking behavior as Ethereum failed to clear the $2,600–$2,650 confluence zone.
What’s Happening With Ethereum’s Price?
In short, Ethereum price today is caught in a tight equilibrium. Smart money demand zones are holding, but weak momentum and failure to break out of resistance-heavy zones are leading to short-term bearish drifts. The market awaits a breakout beyond either $2,635 or below $2,400 to trigger stronger directional conviction.
Short-Term Ethereum Forecast
| Level Type | Key Levels |
| Resistance 1 | $2,635 |
| Resistance 2 | $2,746 (Fib 0.5) |
| Support 1 | $2,428 |
| Support 2 | $2,306 |
| Trend Channel | Downsloping |
| SAR Signal | Bearish Flip |
| VWAP Trend | Flat |
| Smart Money Zone | $2,420–$2,630 |
| Bull Band (Weekly) | $2,219–$2,406 |
If Ethereum closes below $2,500 today, expect more downside pressure toward $2,428. However, if it can reclaim and hold above $2,550 with volume, bulls could attempt another push toward $2,635–$2,660. Until then, range trading and false breakouts are likely to dominate the landscape.
Disclaimer: The information presented in this article is for informational and educational purposes only. The article does not constitute financial advice or advice of any kind. Coin Edition is not responsible for any losses incurred as a result of the utilization of content, products, or services mentioned. Readers are advised to exercise caution before taking any action related to the company.