On-chain data suggests Ethereum doesn’t face any dominant resistance levels until $3,417, something that could open up the path to the mark.
Ethereum Cost Basis Distribution Shows Resistance Ahead Is More Spread Out
In a new post on X, the on-chain analytics firm Glassnode has talked about how the Cost Basis Distribution is looking for Ethereum right now. The “Cost Basis Distribution” is an indicator that tells us about how much of the asset’s supply was last purchased at which price levels.
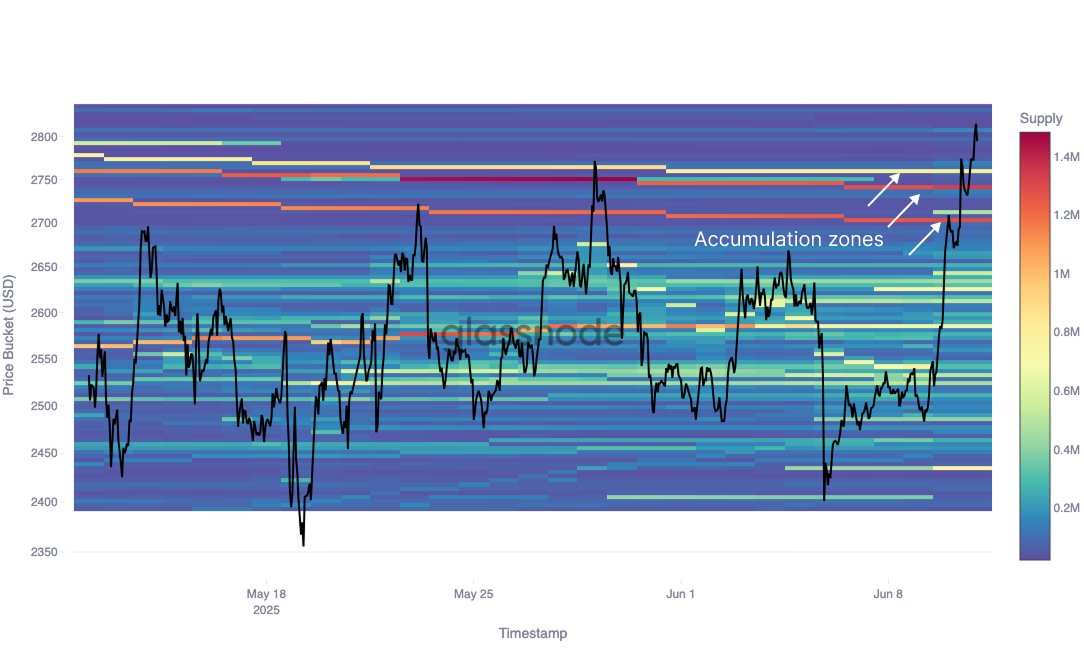
First, here is a chart that shows what the cryptocurrency’s latest breakout has been like from the perspective of this indicator:

As displayed in the above graph, Ethereum has managed to break through a few notable supply levels with the latest price surge. Both the $2,700 and $2,740 levels hold the cost basis of about 1.3 million ETH, while the $2,760 mark holds that of 800,000 ETH. In on-chain analysis, levels concentrated with supply are considered important, due to the simple fact that investors are likely to show a reaction to price interactions with their cost basis.
When this retest occurs from below, the holders may react by selling their coins. Loss investors can be desperate to get back into the green, so when the price does return to their break-even, they can panic and exit out of fear that they will go back underwater in the near future.
Naturally, the more investors that share their cost basis at a particular level, the stronger this kind of selling reaction tends to be. As such, levels above that hold a significant amount of supply can act as resistance barriers to ETH’s price. Ethereum was earlier stuck under the aforementioned supply zones for a month, potentially because of this resistance effect, but now the cryptocurrency has finally reclaimed them.
Just like how strong levels above can pose resistance, those below can be a center of support instead. As such, it’s possible that the role of the $2,700, $2,740, and $2,760 supply walls would now change. “These investors accumulated during consolidation and now will potentially form a strong support zone,” notes Glassnode.
The support effect can arise from holders carrying a bullish mindset and looking at declines to their cost basis as dip-buying opportunities, or simply from them wanting to protect their acquisition boundary.
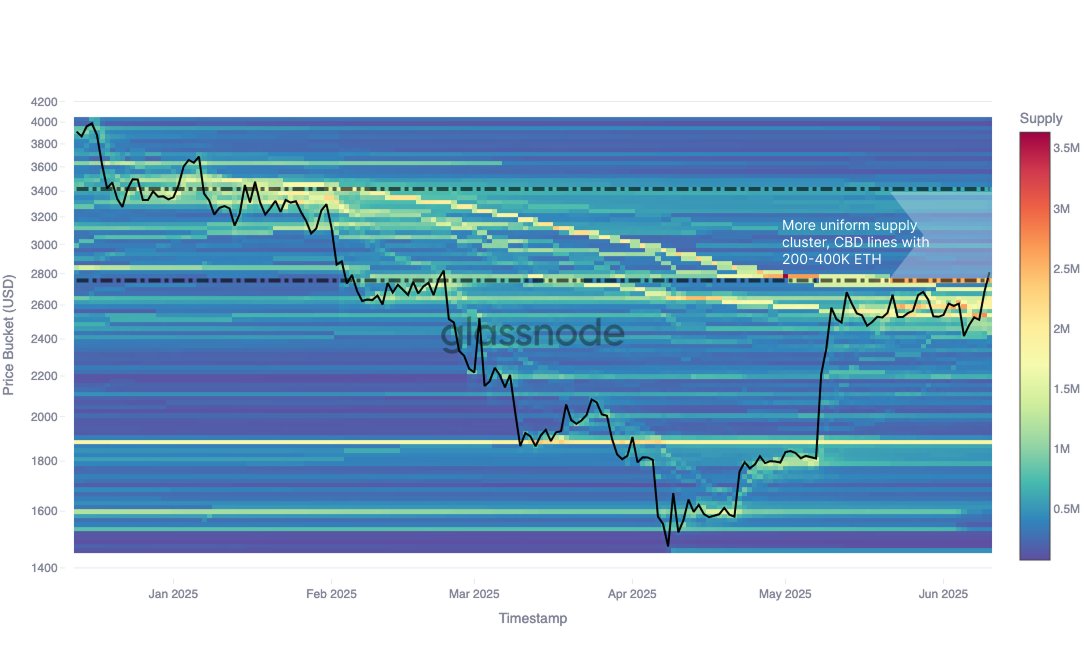
Now, here is another chart shared by the analytics firm that shows how the Ethereum Cost Basis Distribution looks for the levels ahead of the latest spot value:

From the graph, it’s visible that the levels ahead have the Ethereum supply distributed in a more uniform manner, with no strong clusters present until $3,417. More specifically, the price levels before this mark contain 200,000 to 400,000 ETH at every $50 gap. In comparison, the $3,417 level currently holds the cost basis of about 607,950 ETH.
“If the $2.70K–$2.76K support range holds, the path to $3.42K remains technically open – but the response from holders in the $2.8K–$3.3K range will define how quickly ETH can climb – currently, it’s already 47.5% up QTD,” explains Glassnode.
ETH Price
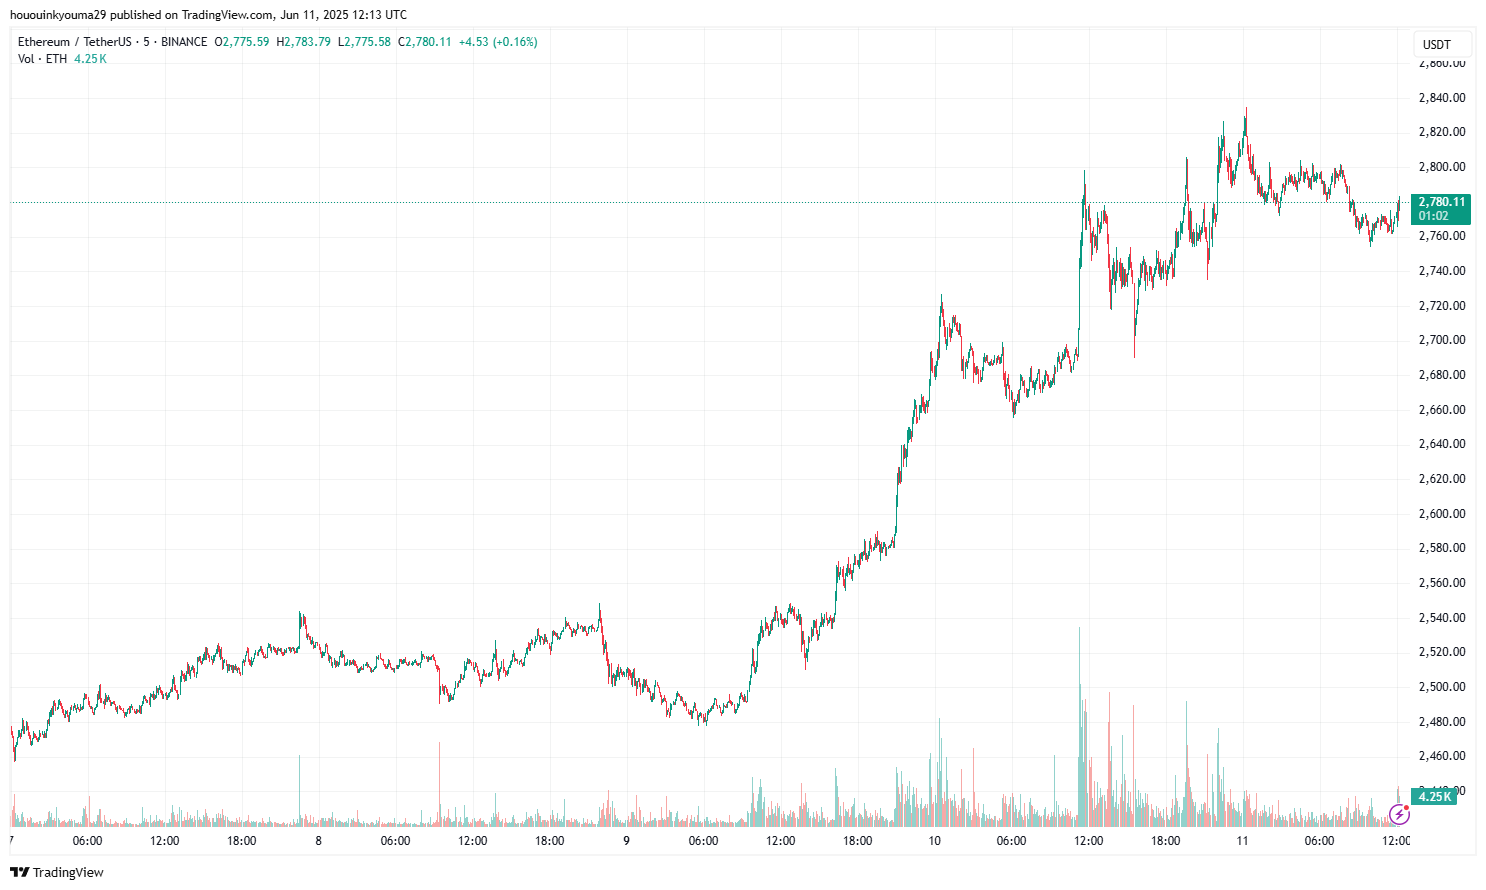
Ethereum briefly broke above $2,830 in the past day, but the coin has since faced a pullback as it’s back at $2,780.

 newsbtc.com