Ethereum has dropped below $2,500 amid rising bearish momentum. With long liquidations surging and the RSI weakening, ETH risks falling toward the $2,000 mark.
As Bitcoin risks losing the $105,000 level, Ethereum has dipped below $2,500. Facing a steeper correction and growing downside risk, can Ethereum hold above the 200-day EMA, or will it slide to $2,019?
Ethereum Price Analysis
On the daily chart, Ethereum remains in a sideways trend despite a more than 7% drop on Thursday. Following a short-term recovery, Ethereum is holding above the 38.2% Fibonacci retracement level near $2,400.
With this brief rebound, Ethereum has moved back above the 200-day EMA at $2,461. However, with an intraday pullback of nearly 1% after Sunday’s Doji candle, ETH signals a possible decline toward the 38.2% Fibonacci level.
The RSI indicator suggests a bearish end to the consolidation phase, as the RSI line trends downward toward the midpoint. A bearish divergence is also emerging, indicating a gradual increase in bearish pressure and heightened downside risk.
According to Fibonacci levels, a daily close below the 38.2% retracement could lead ETH toward the psychological $2,000 level, just below the 23.6% Fibonacci level.
However, intermediate support from the 50-day and 100-day EMA lines at $2,357 and $2,319 may serve as key defenses. On the bullish side, any potential reversal would likely face resistance at the 50% Fibonacci level, around $2,699.
Long Liquidations Hit $26 Million
With the intraday pullback, sellers are gaining the upper hand in Ethereum derivatives. Over the past 24 hours, long liquidations surged to $26.89 million, while short liquidations were at $9.16 million.
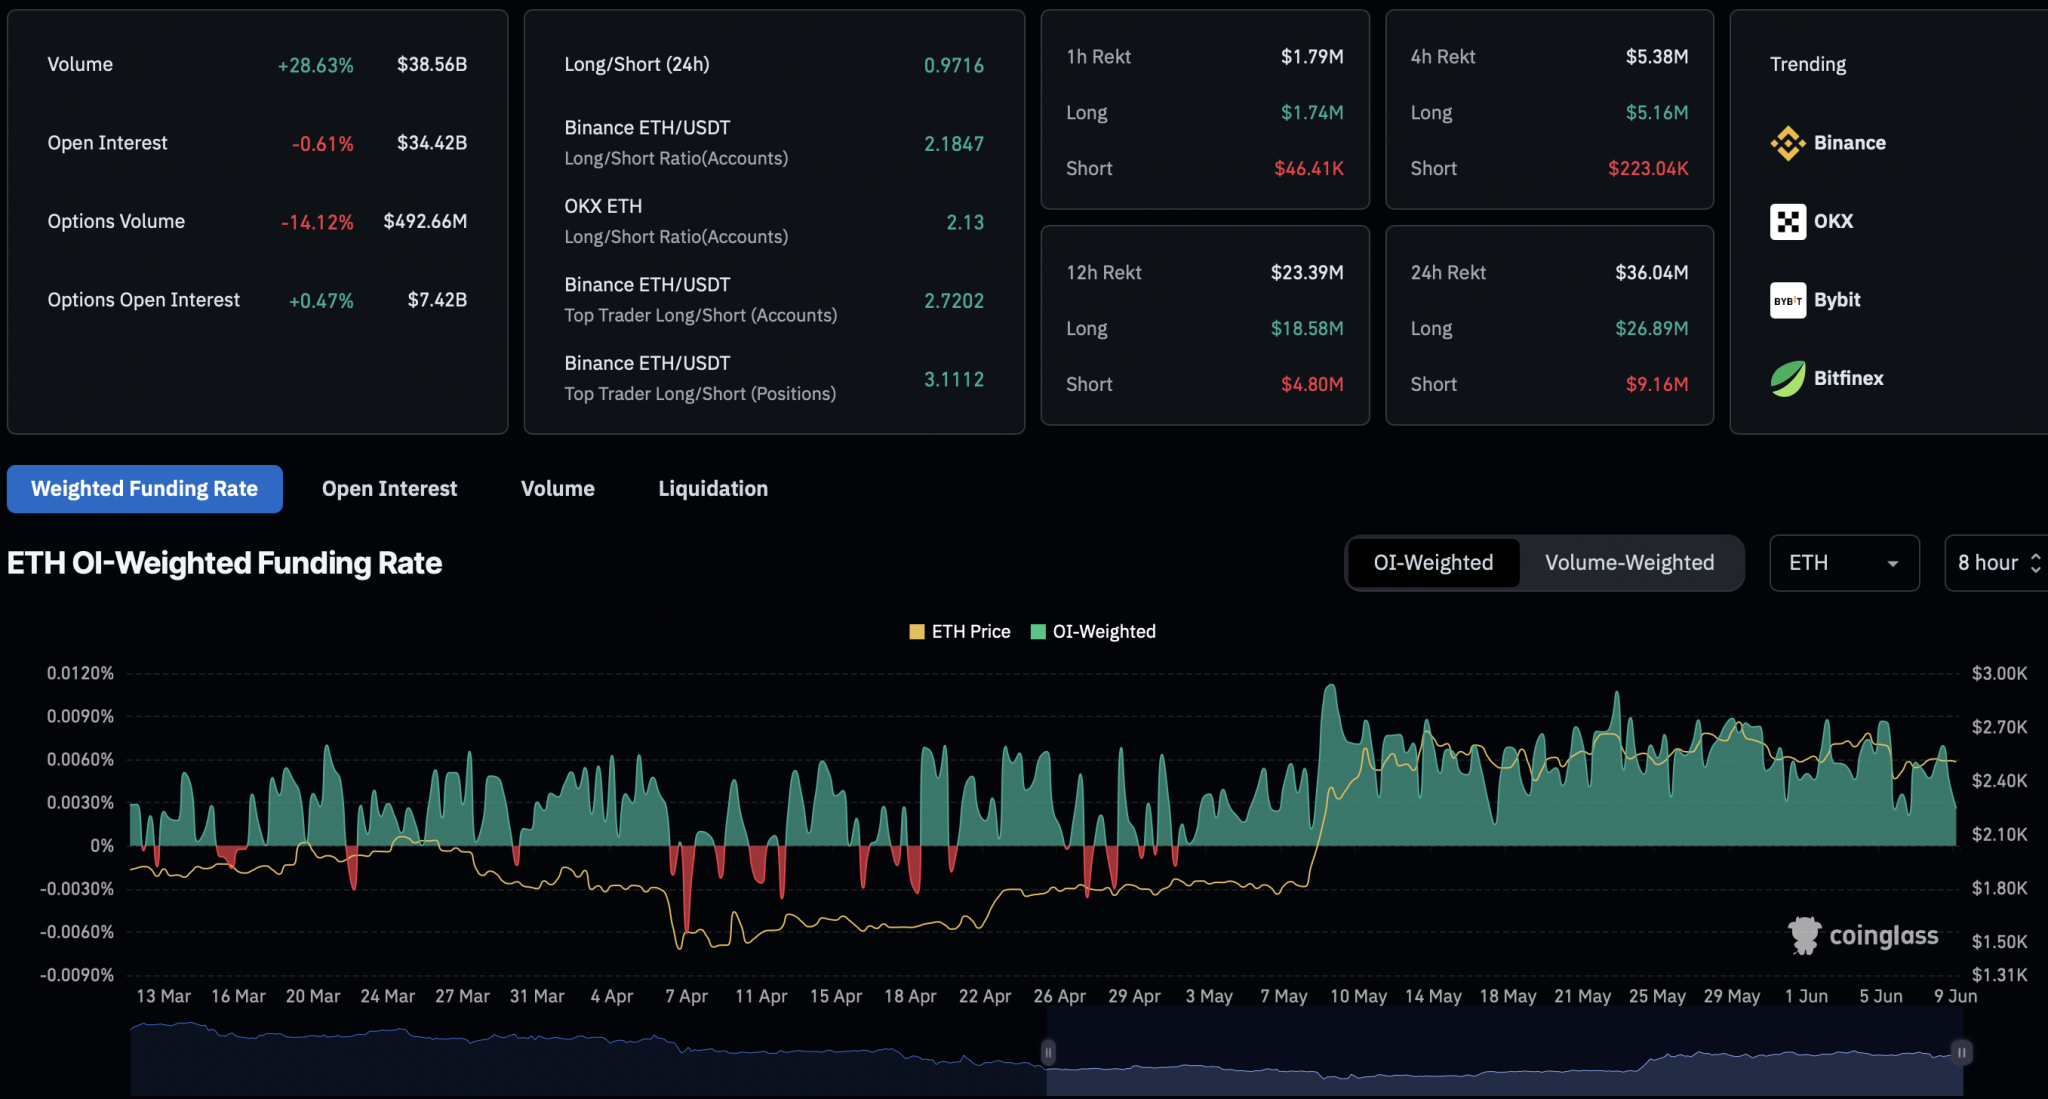
Following this wipeout of bullish positions, the long-to-short ratio now stands at 0.97, indicating a higher number of short positions. In response, open interest has declined by 0.61% to $34.42 billion, reflecting reduced trader participation.
Bullish sentiment has also cooled, as the OI-weighted funding rate dropped from 0.0070% to 0.0026%. These metrics from CoinGlass underscore bearish dominance in Ethereum derivatives.
Institutions Expand Ethereum Holdings
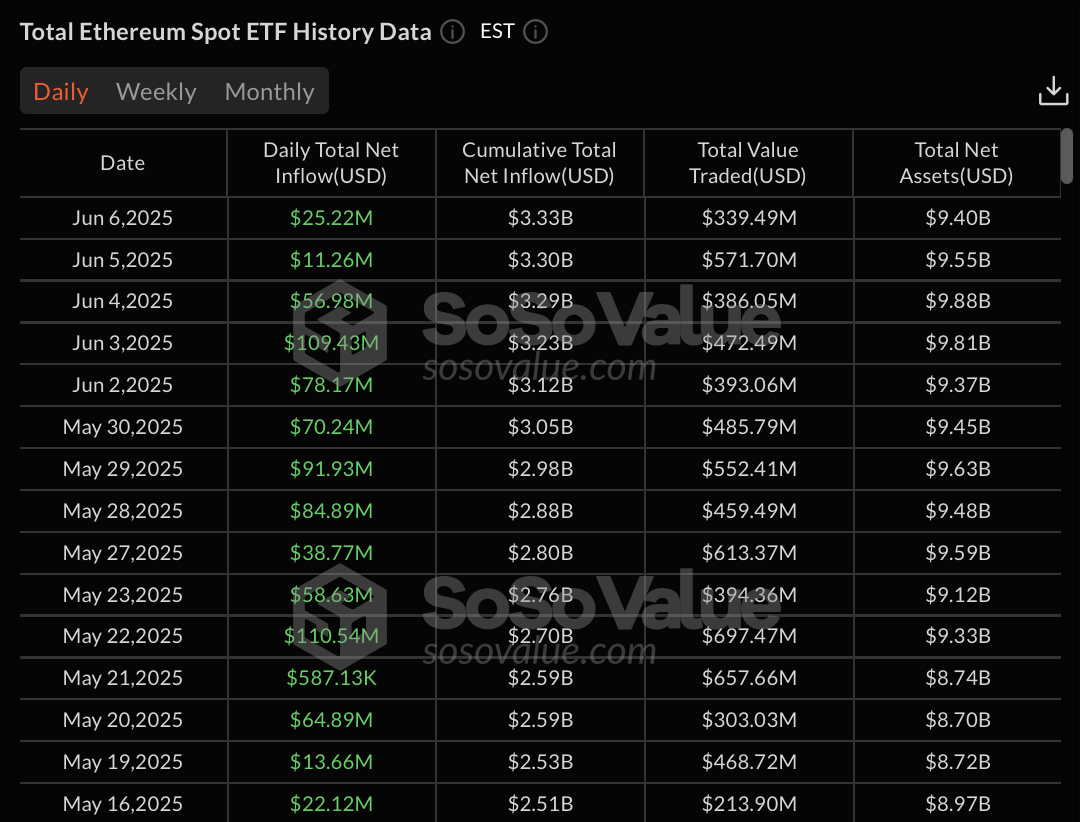
Despite retail traders showing weakness in the derivatives market, institutional support for Ethereum remains strong. ETFs appear to be rotating capital from Bitcoin ETFs into Ethereum.
U.S. spot Ethereum ETFs have recorded 15 consecutive days of inflows, totaling over $837 million. On June 6, the net daily inflow reached $25.22 million, led by $15.86 million from BlackRock and $9.37 million from Grayscale.