
 2
2
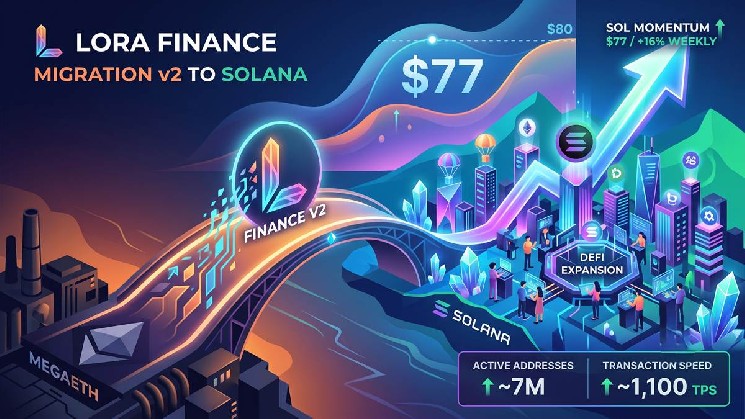
- Strategic migration: Lora Finance moves the deployment of its v2 protocol from MegaETH to the Solana network.
- Rising metrics: Solana’s infrastructure records an average of 1,100 transactions per second (TPS) and is nearing 7 million active addresses.
- Trading levels: The network’s token trades around $77, maintaining critical support in the $73 range.
The decentralized finance protocol Lora Finance officially announced the migration of its v2 version launch from the MegaETH Layer 2 network to the Solana blockchain. The organization based this technical move on the processing speed, available liquidity depth, and diversified access to multiple digital assets offered by the destination ecosystem.
NEW: DeFi protocol @LoraFinance has announced it is migrating from MegaETH to @Solana for v2, citing the network’s speed, deep liquidity, and broader asset access. pic.twitter.com/QgJtvyScE8
— SolanaFloor (@SolanaFloor) July 2, 2026
This migration occurs just as the native token, $SOL, moves near the $77 mark. Although it recorded a 16% increase over the last week, the asset’s value remains at least 74% below its registered all-time high. Market readings provided by traders reflect a split scenario, where internal network activity advances independently of the pressure observed in the macroeconomic price structure.
Infrastructure Expansion and Network Demand

Data recorded on the blockchain shows solid demand from the user community. The latest market report indicates that the volume of active addresses on the network is testing its yearly highs, reaching a figure close to 7 million. At the same time, the system’s operational speed averages a transfer rate of 1,100 transactions per second (TPS), approaching its historical records for technical performance.
Much of the recent transactional dynamism within the ecosystem is closely linked to the issuance of community tokens and the execution of asset free-distribution programs (airdrops). These sectors acted as the primary catalysts to sustain usage levels across the platform’s decentralized applications.
However, market analysts highlight that the acceleration in the use of technical infrastructure is not symmetrically reflected in the digital currency’s financial valuation. The lag between both metrics suggests that price recovery processes are advancing at a slower pace than technical adoption.
Support Levels and Projections on the $SOL Chart
Technical analysis reveals that the asset’s price has stalled in the $77 zone, holding above the key support level set at $73. Data from trading platforms suggest that this range precisely coincides with the 0.786 Fibonacci retracement zone, closely watched by industry specialists.
Technical projections indicate that if the $73 support is eventually lost, traders’ attention could shift toward the demand located at $63.
On the daily chart, the price is attempting to consolidate a solid base within current ranges. Various market reports indicate that a consolidated daily close above the $80 resistance could significantly improve short-term buying momentum. If that threshold is cleared, traders project that subsequent price targets could be established in the range between $100 and $120.
The month of July presents itself as a decisive period for defining the asset’s structural trajectory, leaving to be seen the impact of the upcoming Alpenglow consensus upgrade, projected for the end of the third quarter of 2026.
