


 1
1
Bitcoin has held above $85,000 after gaining 12.3% over the past seven days, with improving spot demand and ETF inflows supporting the recovery.
According to Glassnode, spot and perpetual buyers drove the latest rebound, while short liquidations accelerated the move as $BTC recovered from levels near $76,000 last week.
Bitcoin traded near $86,300 on Sept. 22, up around 1% over the previous 24 hours.
The cryptocurrency briefly climbed above $87,000 before retreating, leaving the $86,000 to $87,500 region as the immediate area where sellers have slowed the move.
The rebound has been supported by a change in spot market activity.
According to Glassnode, exchange taker flows moved from net selling to net buying as trading volume increased, indicating that spot buyers participated in the recovery alongside leveraged traders.
US spot Bitcoin exchange-traded funds have provided another source of demand.
Continued inflows could help absorb selling near recent highs, particularly if $BTC remains above $85,000 instead of giving back a large part of its seven-day gain.
According to Glassnode data, Bitcoin’s futures open interest had moved above its historical upper band, while funding rates were elevated and options open interest was close to $41 billion.
High leverage can amplify moves in either direction. A break above the recent highs could force more short positions to close, while a rejection could expose leveraged long positions to liquidations.
The 48-hour Binance $BTC/USDT liquidation heatmap from CoinGlass shows one of the strongest nearby liquidity concentrations between $84,000 and $84,500.
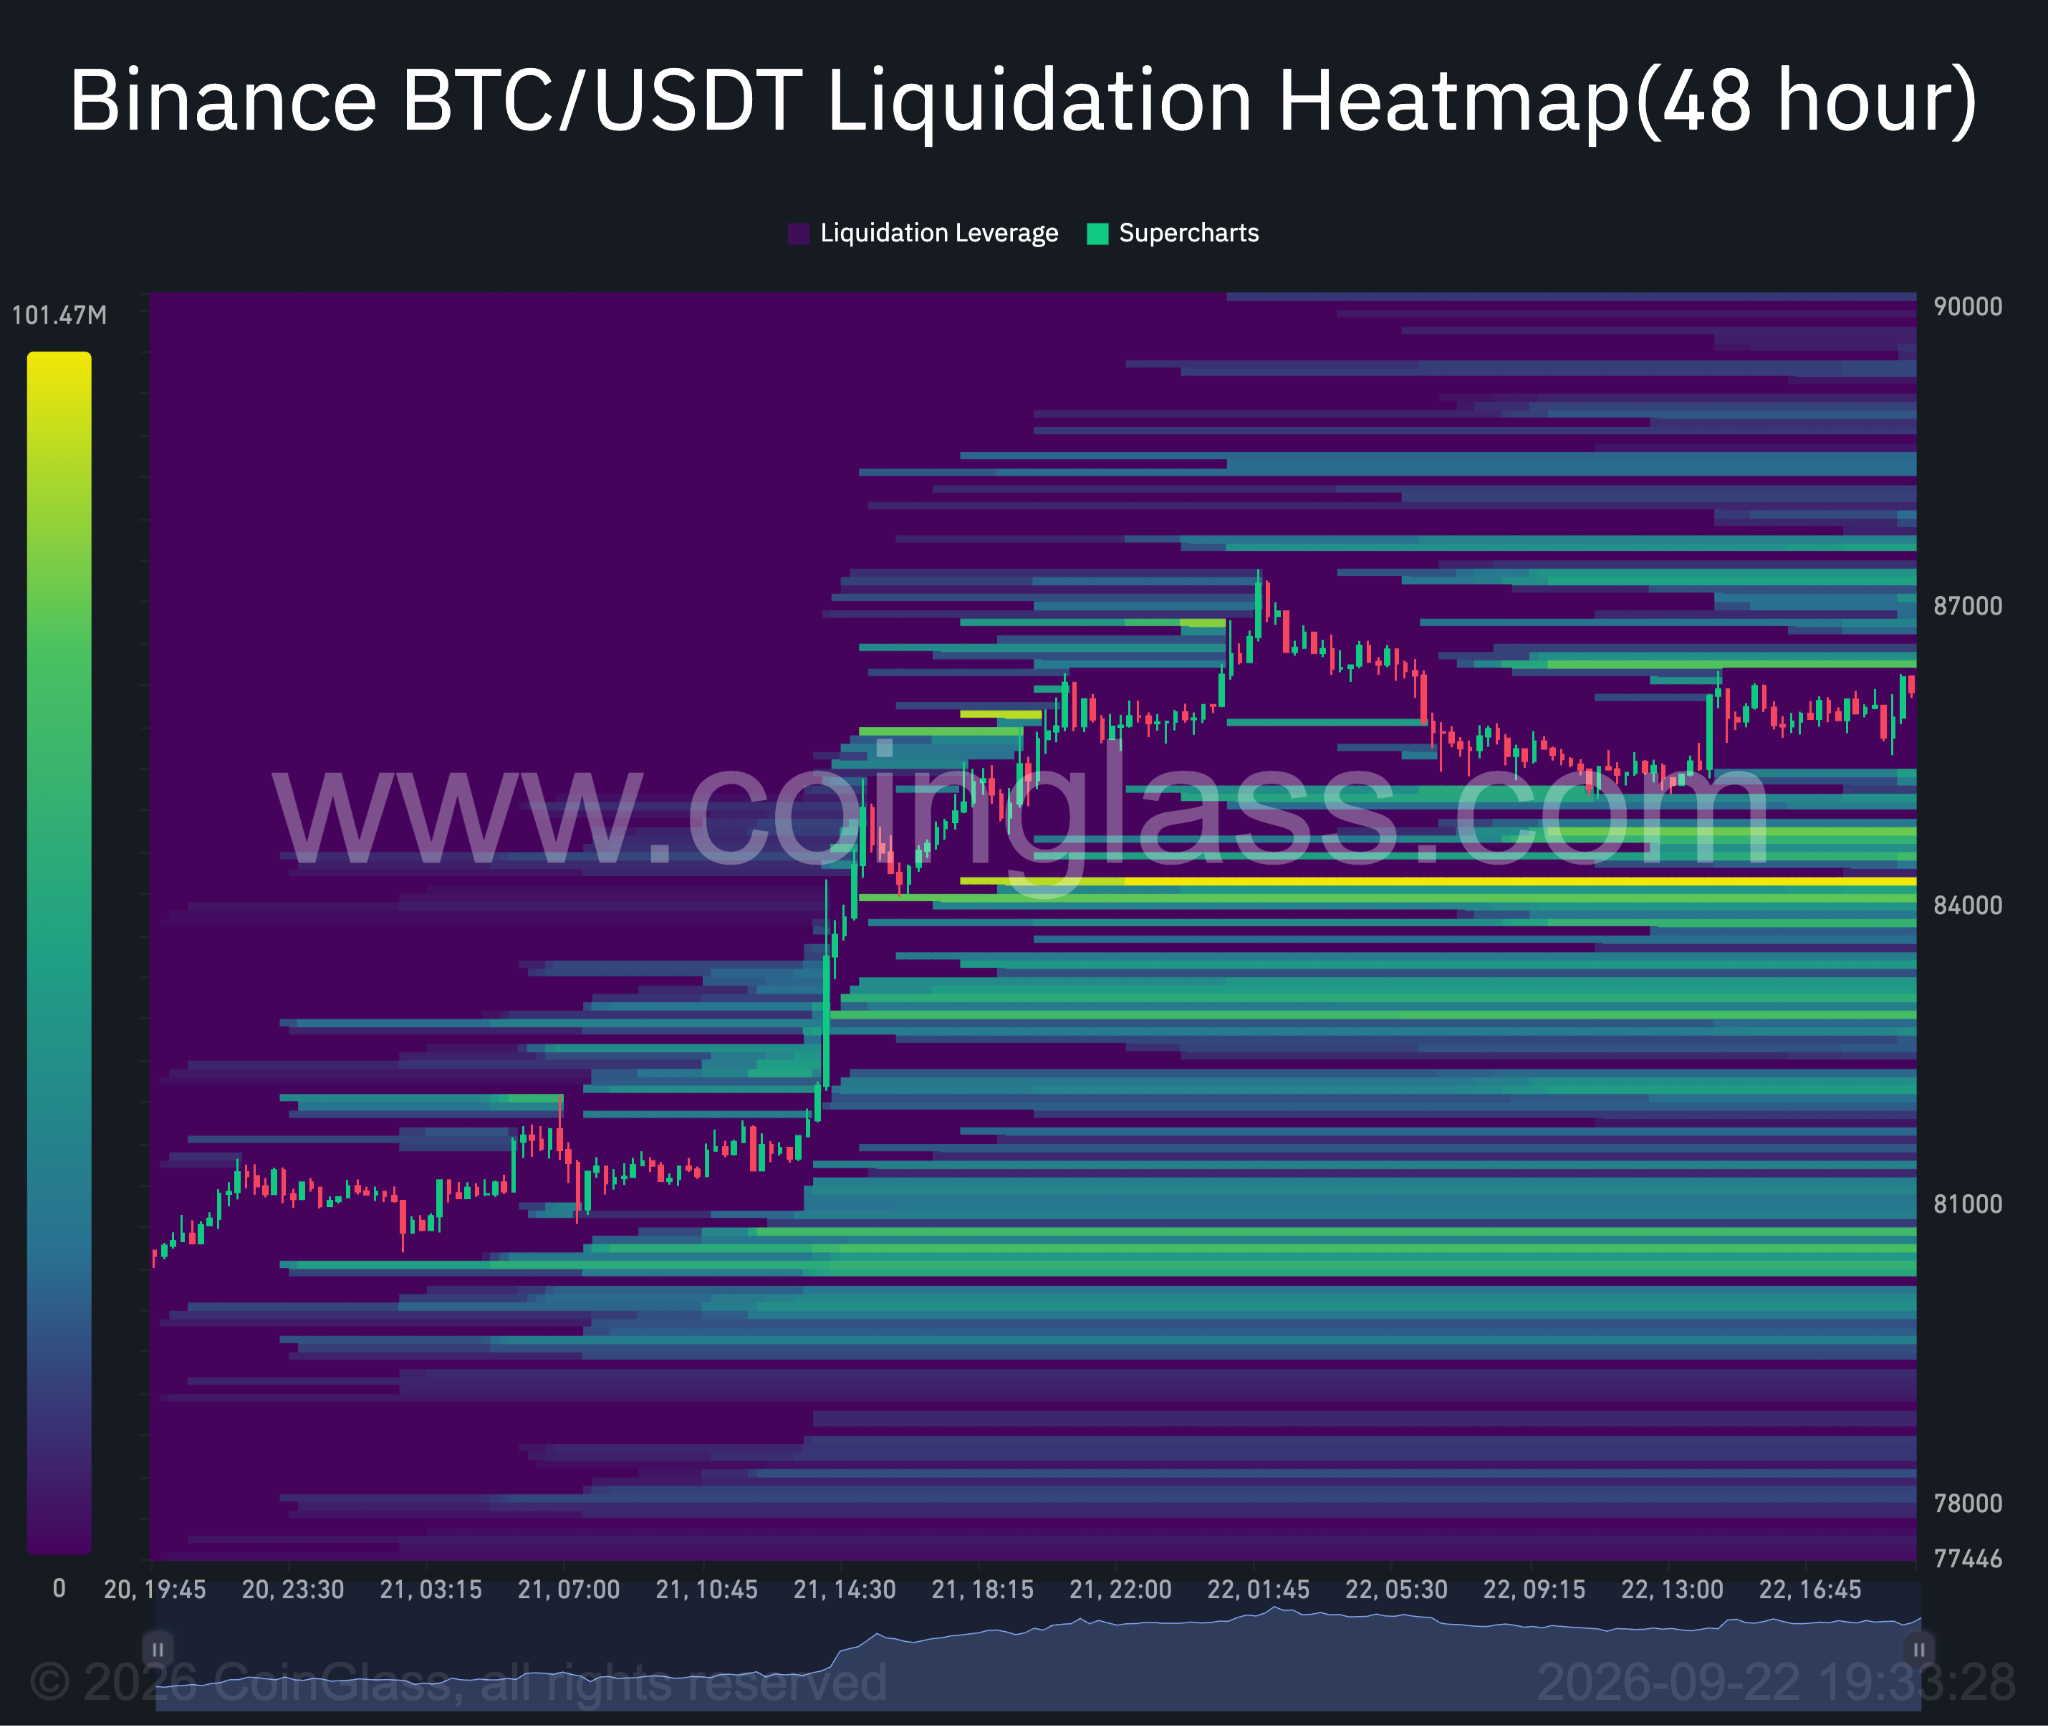
Several smaller bands sit above the market between $86,500 and $87,500, while liquidity extends towards $88,000 to $90,000.
With $BTC holding above $85,000, price now sits between the large pool of leveraged positions below and the liquidity clustered around its recent highs.
A move through $87,500 could therefore take $BTC towards the higher bands, while a loss of $85,000 would bring the $84,000 to $84,500 concentration back into play.
Macro conditions currently offer some support for a move towards the upper liquidity bands, as falling oil prices have reduced fears of another inflation shock.
Brent crude dropped 2.1% to $98.23 on Sept. 22 after reports that Iran could reopen the Strait of Hormuz, while Saudi Arabia restarted its East-West Pipeline.
Lower crude has helped ease pressure on Treasury yields, giving risk assets more room to recover.
The 10-year US Treasury yield nevertheless remained near 4.9%, while markets were pricing roughly a 50% chance of another Federal Reserve rate increase in October.
Traders, however, should keep in mind that renewed hostility around Hormuz that sends Brent decisively back above $100 could quickly reverse that support.
Higher oil could revive inflation concerns and keep Treasury yields elevated, increasing the risk that $BTC loses $85,000 and moves towards the $84,000 to $84,500 liquidity concentration.
$BTC price analysis
Bitcoin's daily chart shows price trading near $86,140 after reaching an intraday high of $86,602. See below.
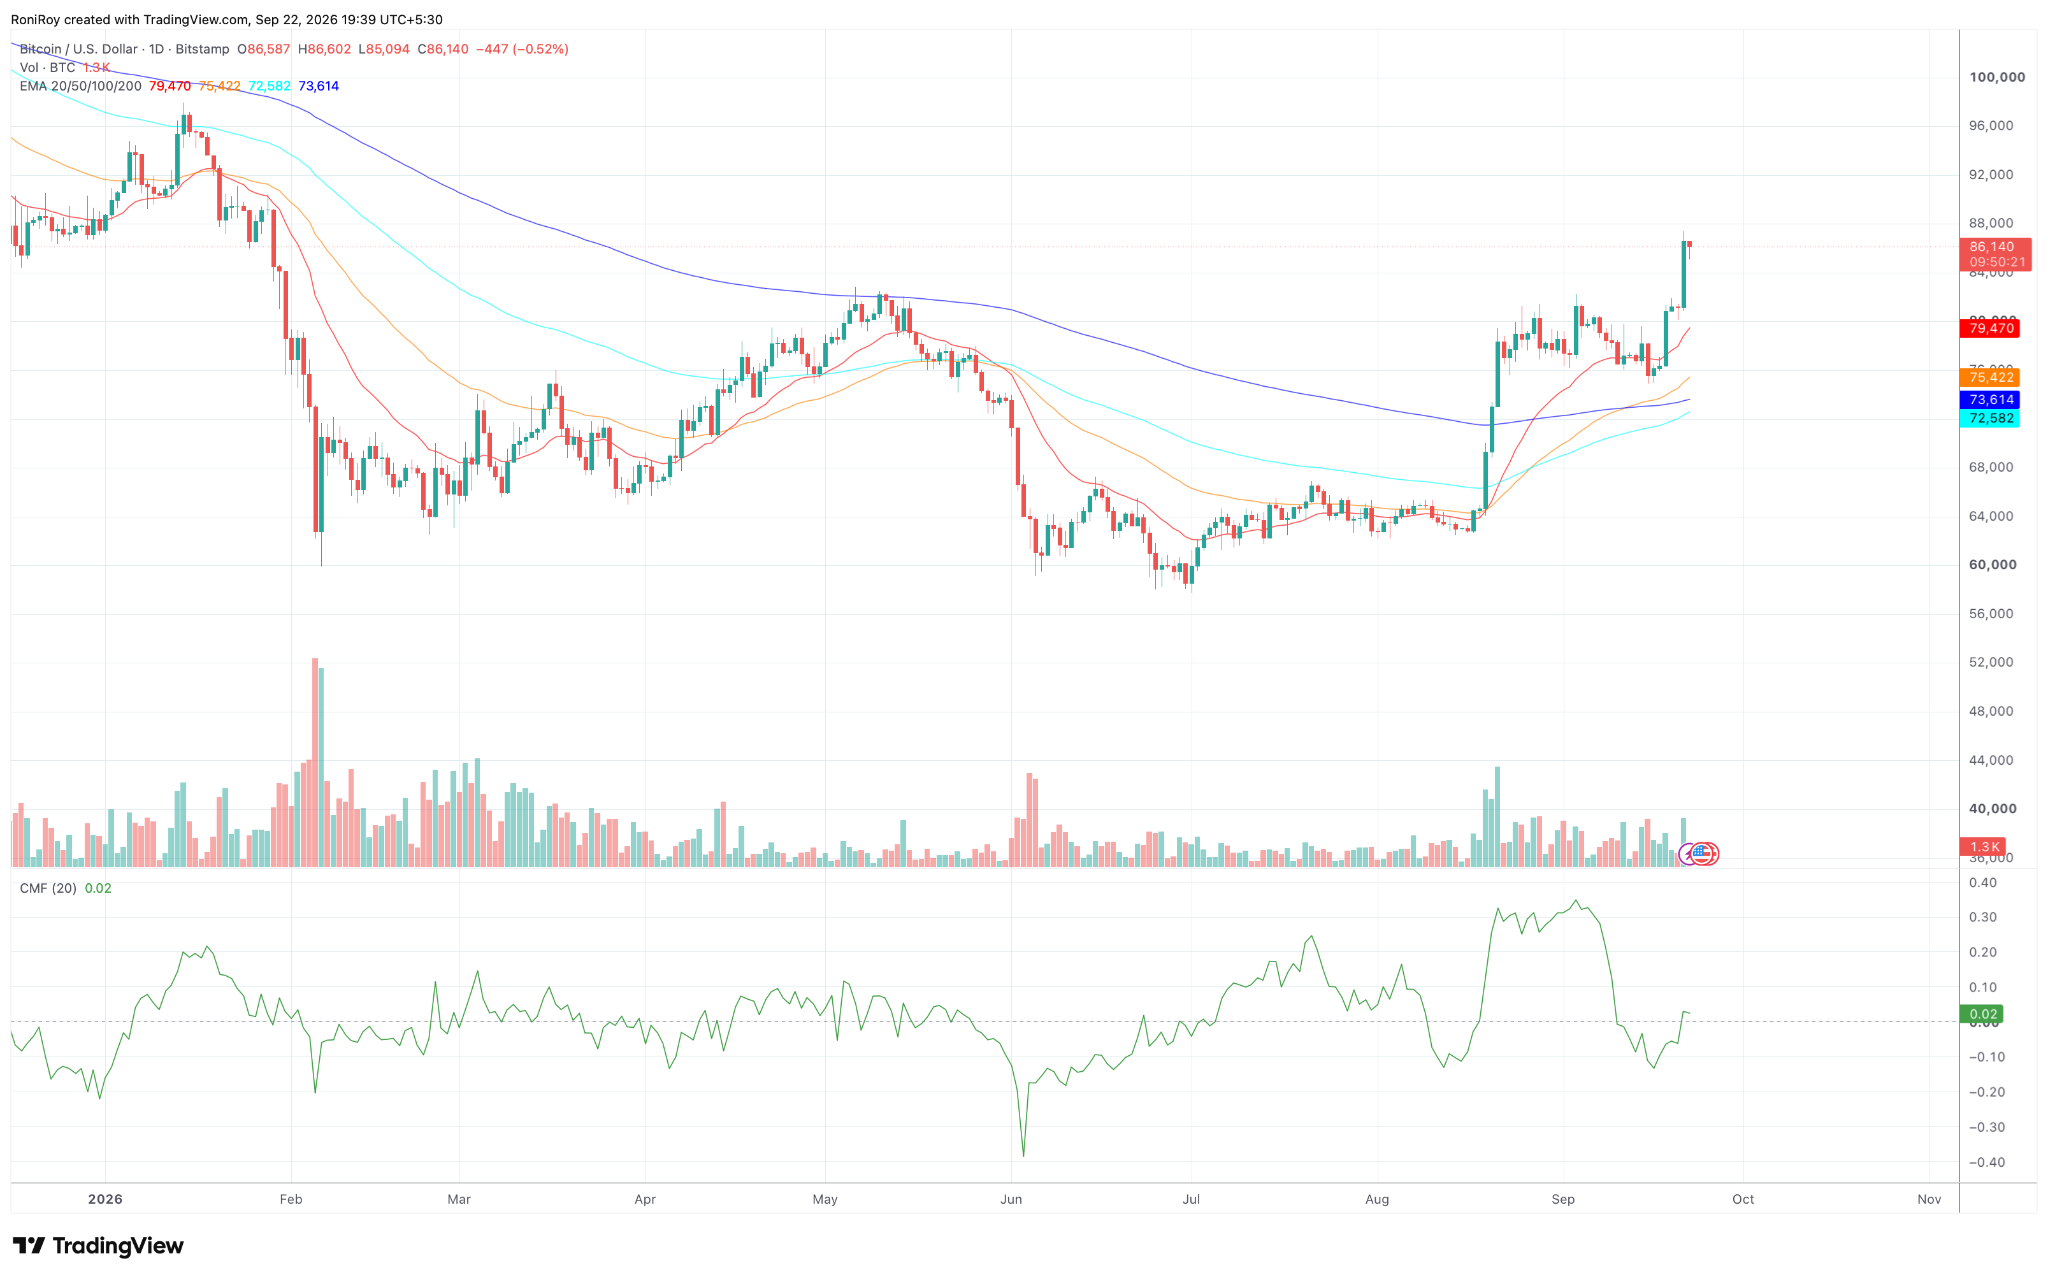
As seen on the chart, $BTC remains well above its 20 day EMA at $79,470, 50 day EMA at $75,422, 100 day EMA at $72,582 and 200 day EMA at $73,614.
All four averages sit below the current price, while the 20-day EMA has turned higher.
The structure therefore favours another attempt at the recent highs as long as $BTC remains above $85,000, with $87,100 to $87,500 forming the first area that needs to be cleared.
Chaikin Money Flow has recovered from negative territory to 0.02, showing that buying pressure has returned.
The reading remains only slightly above zero, however, so stronger inflows would be needed to support a sustained breakout as $BTC approaches resistance.
The 4 hour chart gives the upside scenario a slight edge. Bitcoin has moved above the 0.786 Fibonacci extension at $85,608 and is approaching the 1.0 extension at $87,106, while price has already briefly traded above $87,000.
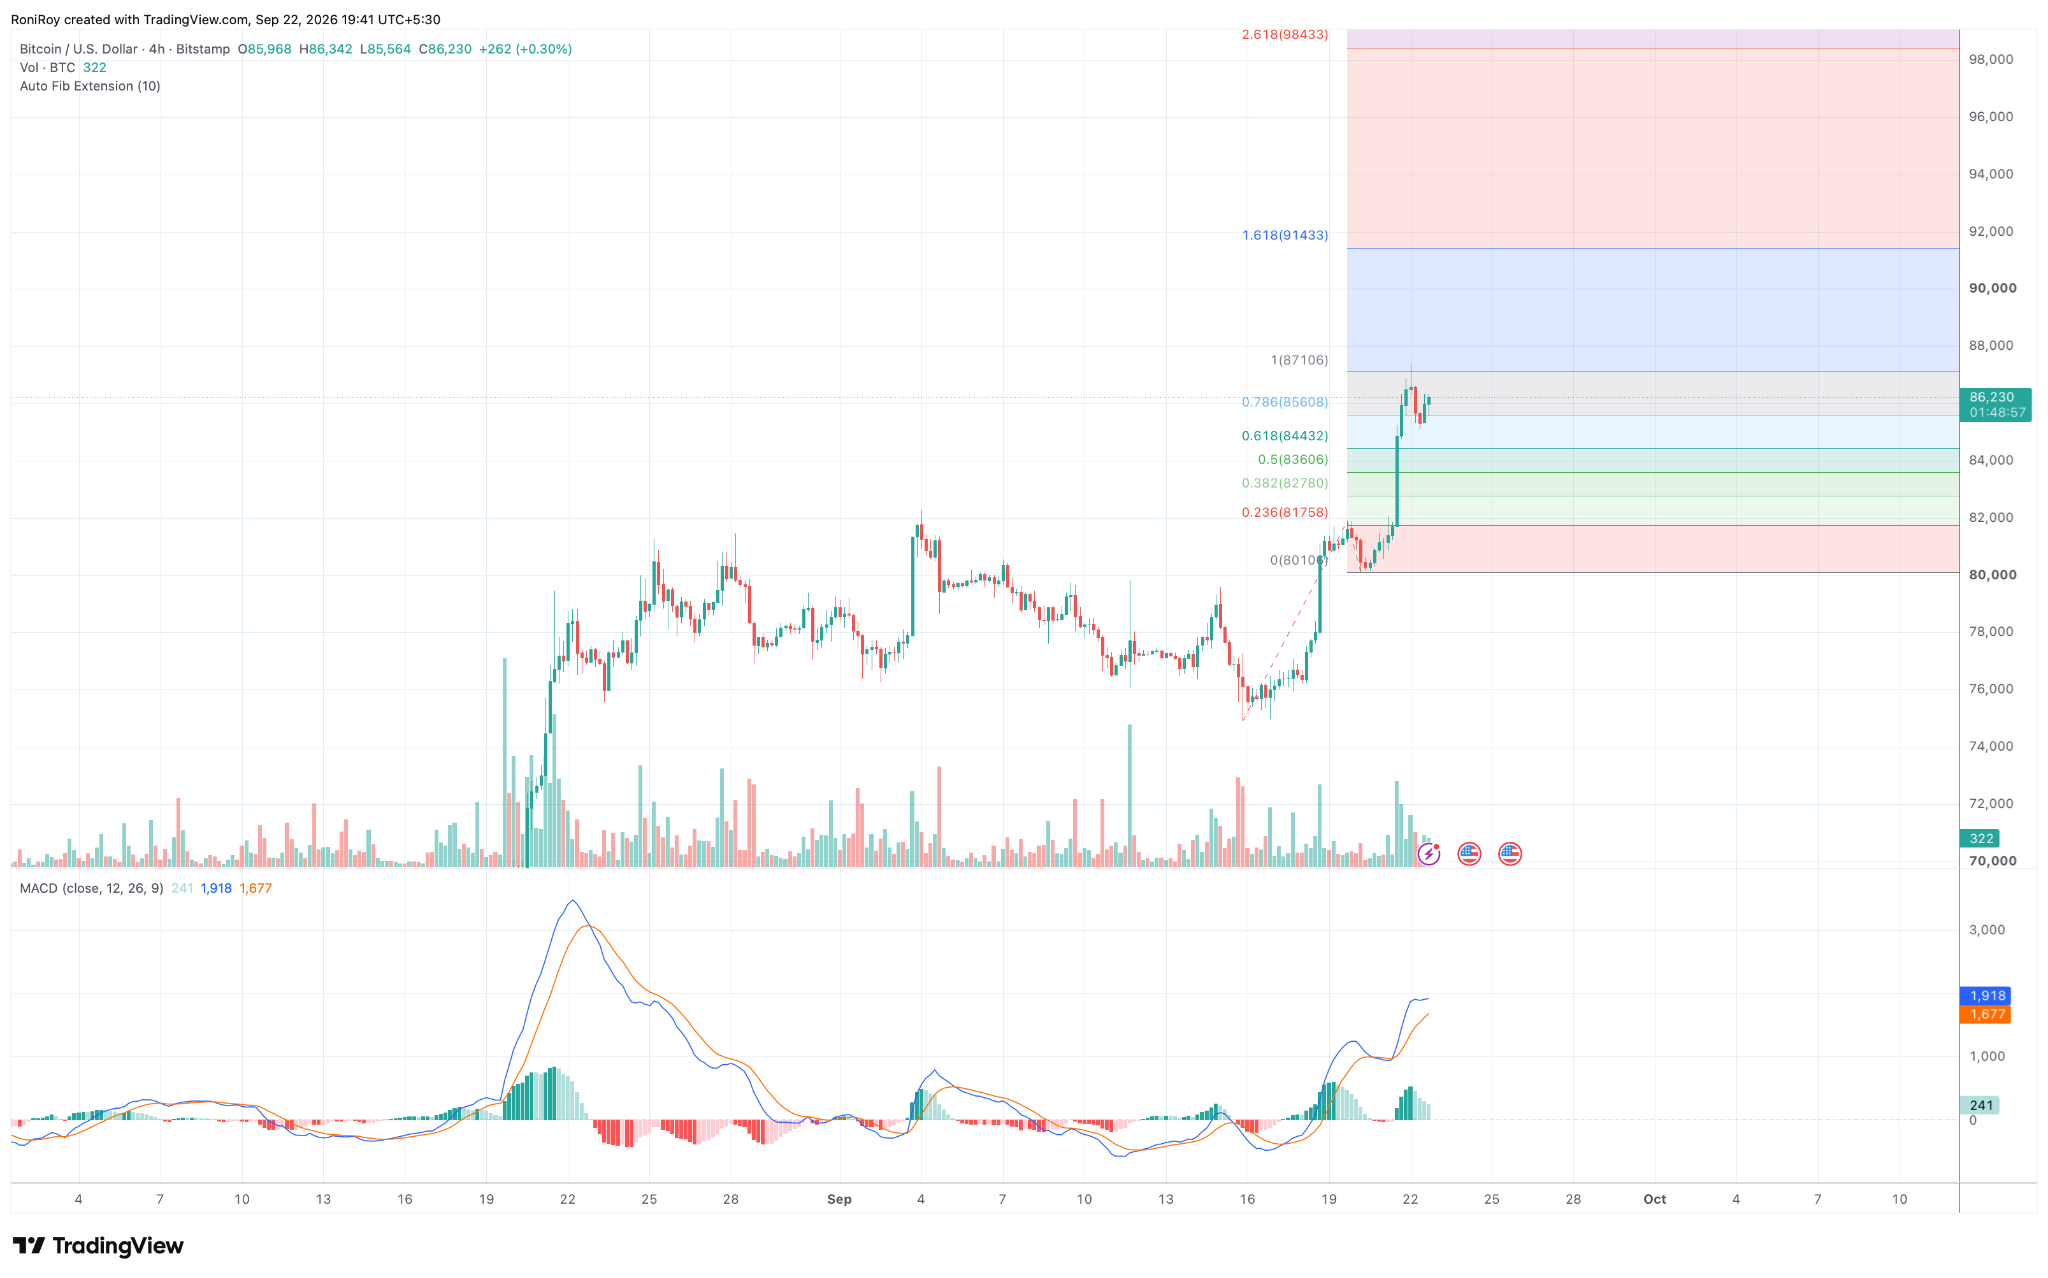
A strong move above $87,100 to $87,500 could first draw $BTC towards the liquidation concentrations between $88,000 and $90,000.
If buyers clear that area, the 1.618 Fibonacci extension at $91,433 becomes the next probable upside target.
MACD supports another attempt higher. The MACD line stands near 1,918 compared with the signal line at 1,677, while the histogram remains positive at 241.
Upward momentum has therefore remained intact despite the pullback from the latest high.
As such, the EMA structure, positive CMF, and the bullish 4-hour MACD currently favour Bitcoin holding above $85,000 and making another attempt at $87,500.
A confirmed breakout would strengthen the case for $88,000 to $90,000 first, followed by $91,433 if buying pressure persists.
On the contrary, the bullish scenario would weaken if $BTC falls back below the 0.786 Fibonacci extension at $85,608 and fails to reclaim $85,000.
The next Fibonacci levels sit at $84,432 and $83,606, while the CoinGlass heatmap shows a heavy liquidation concentration between $84,000 and $84,500.
A break below that liquidity zone would expose the Fibonacci levels at $82,780 and $81,758.
The measured move begins near $80,100, with the rising daily 20-day EMA at $79,470 providing the next major dynamic support below it.

 en.bitcoinsistemi.com
 u.today
 cryptoslate.com