


 1
1
Bitcoin price prediction after today’s CPI report stays bullish above $76,706, the level $BTC needs to hold to avoid a quicker drop toward $72,000.
Bitcoin Price Analysis: Did $BTC Just Print a Pump-and-Dump Wick?
Bitcoin Price Analysis (Source: TradingView)
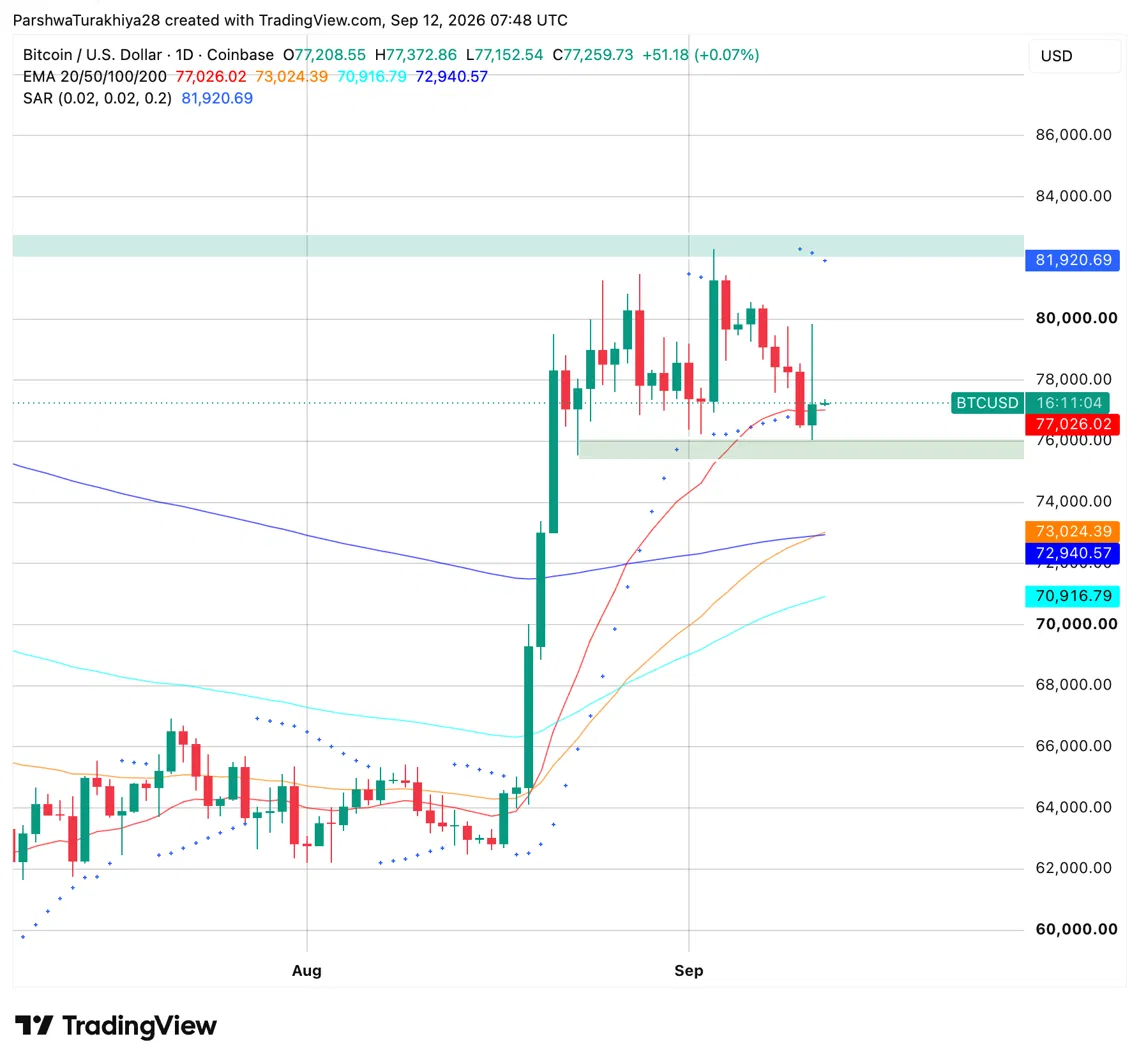
$BTC trades near $77,259.73, trading flat today, almost the same level it sat at before this week’s CPI release. Price spent most of August in a tight range, then broke out sharply in early September, running from the low $60,000s to a peak above $81,000. It’s held between $76,000 and $77,000 for the past several sessions since.
That zone got tested directly on the CPI release. Price spiked toward $79,800 during the reaction, then reversed just as fast, giving back the whole move and landing back near $77,000, leaving a long upper wick on the chart. The Parabolic SAR sits well above price at $81,920.69, so the short-term trend hasn’t turned bullish despite the spike. Price still holds above the 20-day EMA at $77,026.02 and the 50-day at $73,024.39, so the broader structure stays intact.
$BTC Support and Resistance Levels, September 12, 2026
| Type | Price |
| Resistance | $79,800 |
| Resistance | $81,921 |
| Resistance | $82,500 |
| Support | $76,706 |
| Support | $73,024 |
| Support | $72,940 |
$BTC News: A 90-Minute Whipsaw After Sticky Core Inflation Data
Bitcoin’s reaction to Thursday’s CPI report was, in Coin Edition’s words, a textbook positioning trap. Headline CPI held at 3.4% year-over-year, in line with expectations, and sparked an immediate relief rally. That faded fast once the details came in: monthly CPI rose 0.4%, core CPI rose 0.3%, and core services excluding housing jumped 0.5%, the numbers that actually spooked the market.
Price moved just as fast:
- 8:30 AM: $BTC drops $1,120 in a single minute on the release
- 9:30 AM: reverses hard as markets open
- 10:00 AM: climbs 5% to peak near $79,800
- 11:55 AM: slides $2,500 back to $77,300
Polymarket’s odds of a 25 basis point Fed hike jumped from around 60% to above 85% on the data, with the 10-year yield near 4.95-4.97% and the 30-year briefly topping a 22-year high above 5.1%. CoinShares called the report “not particularly helpful for Bitcoin,” pointing to core inflation running slightly hot.
Not everything in the report cuts against $BTC. Some analysts noted Bitcoin’s 90-day correlation with gold has climbed above 0.59, and that $BTC has outperformed gold on days bond prices fell sharply, a pattern some read as Bitcoin trading more like a currency-debasement hedge than a pure risk asset.
Bitcoin Derivatives: Longs Take the Bigger Hit as Volatility Spikes
$BTC Derivative Analysis (Source: Coinglass)
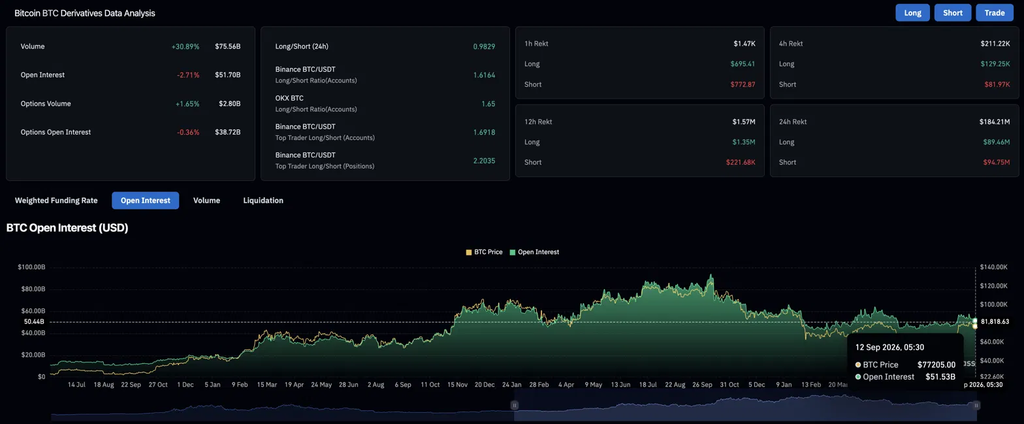
Trading volume jumped 30.89% to $75.56 billion in 24 hours, but open interest fell 2.71% to $51.70 billion, more people trading, fewer positions left standing, which fits today’s sharp back-and-forth in price. Options volume ticked up 1.65% to $2.80 billion.
Liquidations came in close to even, $89.46 million in longs versus $94.75 million in shorts. But traders themselves stayed bullish through it, Binance’s long/short ratio sits at 1.62, and its top traders lean even more long, up to 2.20.
| Metric | Value | What it shows |
| Derivatives volume (24h) | $75.56B, up 30.89% | Trading activity spiking with the CPI volatility |
| Open interest | $51.70B, down 2.71% | Positions trimmed despite the volume surge |
| 24h liquidations | $184.21M total | Roughly split between longs and shorts |
| Binance top trader long/short | 2.20 | Sophisticated positioning still leaning long |
Bitcoin ETF Flows: A Second Straight Outflow Day After a Volatile Week
US spot Bitcoin ETFs posted a $13.29 million net outflow on September 11, a far smaller move than Wednesday’s $282.56 million outflow but still the second negative session in a row according to SoSoValue.
That follows a choppy stretch through the week: $730.87 million in inflows on September 3, then outflows of $236.46 million on September 1, $46.65 million on September 8, $120.24 million on September 9, and $282.56 million on September 10. Cumulative net inflows across all Bitcoin ETFs stand at $55.15 billion.
BlackRock’s IBIT led Thursday’s outflow at $19.23 million, while several smaller funds, including VanEck’s HODL and Morgan Stanley’s MSBT, posted modest inflows the same day.
Bitcoin Price Prediction: Bullish and Bearish Scenarios
Bullish Case, Target: $81,921
$BTC holds above $76,706 and a dovish shift in Fed commentary or softer upcoming data eases rate-hike odds back down from 85%. A reclaim of $80,000 would put the Parabolic SAR level at $81,921 back in range.
Bearish Case, Risk Level: $72,000
$BTC loses the 0.786 Fib support at $76,706. Per the independent chart analysis, that break opens a quick dip toward $72,000, especially if yields keep climbing and the Fed’s hawkish repricing holds.
Bitcoin Price Prediction FAQs
What is the Bitcoin price prediction after today’s CPI data?
$BTC stays bullish above $76,706. Holding that level keeps $80,000 and the SAR resistance at $81,921 in range, while losing it opens a quicker path toward $72,000.
Why did Bitcoin swing nearly $5,000 in 90 minutes?
A benign headline CPI print sparked an initial relief rally, which reversed once sticky core inflation and core services data pushed Fed rate-hike odds from around 60% to above 85% on Polymarket.
Is Bitcoin’s move today a real breakdown or a shakeout?
Coin Edition describes it as looking more like a positioning shakeout than a fundamental shift, though $BTC remains net-negative for 2026 and faces resistance near its recent highs.
What would change the bearish setup for Bitcoin?
A dovish shift in Fed commentary or weaker incoming economic data would ease rate-hike odds and open the clearest path back toward renewed upside, according to CoinShares.

 en.bitcoinsistemi.com

 coinfomania.com
 ambcrypto.com