


 1
1
Summary
- Bitcoin closed August at $78,571, its strongest August since 2017.
- Spot ETFs took in a net $2.77 billion over 13 sessions.
- Crowd sentiment stayed weaker during the rally than in flat July.
- Price is compressing above the $75,880 Fibonacci floor.
Bitcoin price dropped to $77,316 on Tuesday, September 2, down 0.16% on the day but holding almost all of an August advance that carried it from roughly $64,700 on August 18 to $78,300 three sessions later. The monthly close at $78,571 finished above the 200-week moving average near $65,000 and above the five-month short-term holder realized price around $72,000, two levels that mark whether long-term and recent buyers respectively are sitting in profit. Institutional money did the work. Between August 14 and September 1, spot Bitcoin ETFs absorbed $3.26 billion in gross inflows against $494.6 million in redemptions spread across just three negative sessions, leaving net demand of $2.77 billion in under three weeks. Retail never showed up.
One Fund Bought Most of August, and the Rest Barely Participated
The flow pattern was persistent rather than explosive, averaging around $213 million a session and peaking on August 20 at $606.3 million. BlackRock’s IBIT supplied $503 million of that single day and $2.22 billion of the period’s net total on its own, which means the marginal buyer in this cycle sits in one product rather than spread across a dozen. Fidelity’s FBTC swung from $111.9 million in to $83.6 million out inside two weeks. Grayscale’s GBTC, a chronic bleeder since 2024, managed one positive day before reverting to small redemptions.
Timing matters more than the total here. Two of the three outflow days landed after the rally, at prices above $77,000, and the September 1 exit of $236.5 million was the largest single-day redemption of the sample. The flow trend enters September carrying less force than it had through mid-August.
PlanB’s Case Rests on Who Has Stopped Needing to Sell
The pseudonymous analyst PlanB treated the August close as a structural shift rather than a bounce, and his reasoning has less to do with the 25% gain than with who is now sitting on profits. Before August, roughly half the circulating supply was underwater. That figure has fallen to around a quarter, which removes a large population of holders who had been waiting to break even before exiting. Monthly momentum flipped alongside it: the RSI on the monthly chart moved back above the midpoint for the first time since the drawdown began, meaning average monthly gains have overtaken average monthly losses.
The rest of his argument runs off the same logic. Bitcoin closed the month well above both the four-year average price and the average cost paid by recent buyers, and average acquisition costs across holder cohorts are climbing again rather than flattening. That combination describes a market where the supply of forced sellers has thinned considerably. PlanB goes further and says he expects higher prices from here, which is a forecast layered on top of the data rather than something the data itself produces.
Bitcoin closed August at $78,571
– Above 200 week MA $65k
– Above 5 month (STH) realized price $72k
– All realized prices are increasing again
– Bitcoin in profit 72% (up from 50%)
– Monthly RSI 51 (up from 41)IMO the bottom is behind us.
I expect higher prices from here. pic.twitter.com/h5IcFoBJG6— PlanB (@100trillionUSD) September 1, 2026
The Crowd Was Louder in July, When Nothing Happened
Santiment measures how positive or negative social chatter around Bitcoin runs on a given day. Its data shows the strangest feature of August: the mood during the rally was consistently weaker than the mood through July, when price sat flat near $63,000 and delivered nothing. At no point during the 25% month did enthusiasm reach even half the peak recorded in that dead month.
Part of the explanation is a hangover. The Coldcard seed exploit at the start of August drove sentiment to its worst reading in months, and the mood had only clawed back to neutral by the time buying began on August 19. A rally starting from neutral will average lower than one starting from optimism. That accounts for the floor, not the ceiling.
Two readings follow. Either the advance lacked participation and stalls once institutional bids pause, or there is enthusiasm still unspent, since tops historically form in euphoria rather than in indifference. Mike McGlone at Bloomberg Intelligence raises a separate objection that ignores sentiment entirely: measured against the S&P 500, Bitcoin has spent roughly five years going sideways relative to an index it carries about three times the volatility to track. By conventional portfolio construction, an asset that correlates highly, risks heavily and returns no better than beta has failed its own audition.
Bitcoin closed August up ~25% and the crowd never got excited about it.
Price ran from ~$64.7K on Aug 18 to ~$78.3K by Aug 21, capping a 25% month and the strongest August since 2017.
Mood did not follow. Our Sentiment Balance averaged +32 across Aug 19 to 31, against +72… pic.twitter.com/iVB3vM7Xk0
— Santiment Intelligence (@SantimentData) September 2, 2026
A Coiling Range That Runs Out of Room Within Days
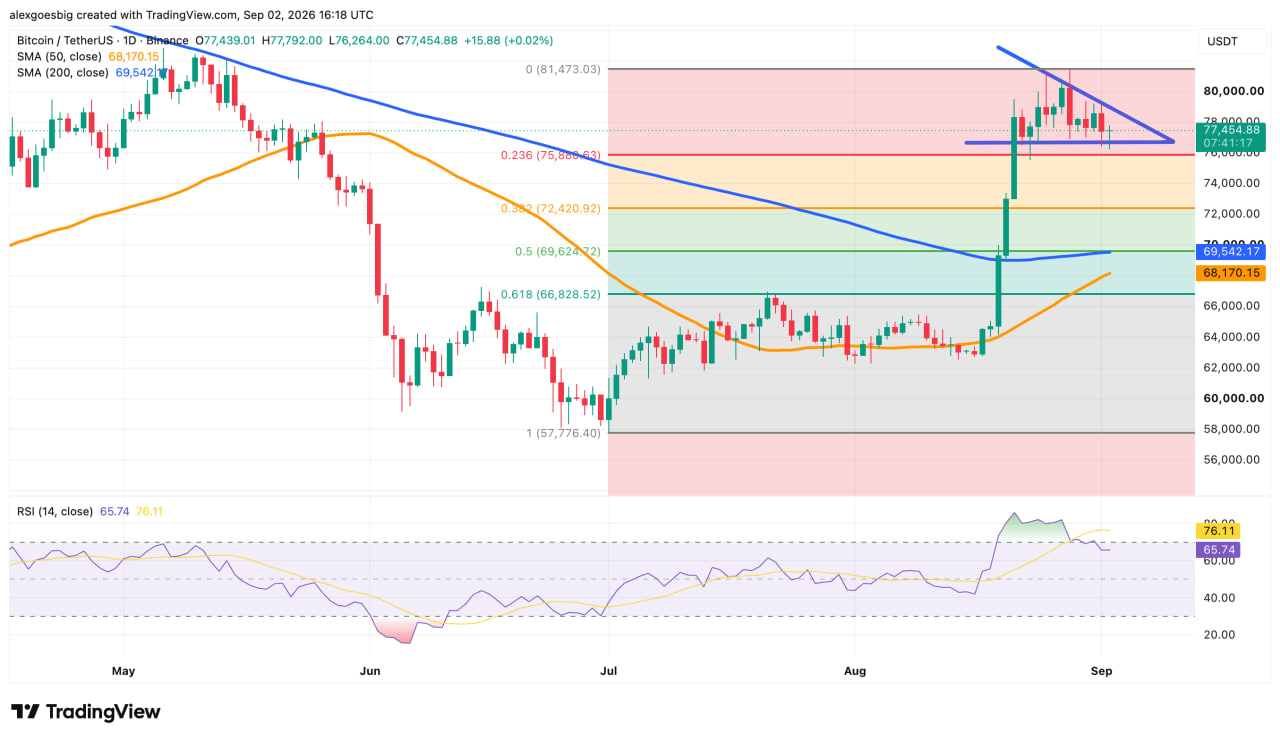
The May decline from $81,473 down to $57,776 supplies the grid that frames the current range. The August 19 candle opened near $64,000 and closed above $72,000, clearing the 200-day moving average at $69,541 and two Fibonacci levels in one session. A move of that shape leaves no intermediate resistance behind it, which is why the market has held its gains instead of retracing into them.
What has happened since is narrower and, to my reading, more informative. Price is squeezing between a descending trendline drawn off the May and June highs and a flat base around $77,000. Lower highs against a level floor is a coiling pattern, and the two lines converge within days, so the question resolves soon in one direction or the other. The RSI gives the tell: the 14-day reading has fallen to 65 while its own signal average sits above 76, meaning momentum has cooled sharply while price has barely moved. The range is being held by an absence of sellers rather than a presence of buyers.
My conclusion is that $75,880 decides it. Daily closes above that level keep the August breakout structure intact and leave the $72,421 to $69,541 zone untested. A close below, particularly on rising volume, resolves the compression downward and puts $72,421 in play within a week; that level also sits close to the average price paid by recent buyers, which makes it the point where the profit cushion PlanB describes starts to erode. The bullish resolution requires a close above $81,473, and momentum at current readings is not the profile of a market that clears that without resetting first.
A Second Negative Week Removes the Floor’s Only External Support
All three redemption days cluster around current prices, and the biggest arrived on September 1. Another negative week turns the $2.77 billion August cushion from an active supply constraint into a spent one, and $75,880 loses the flow support that has been holding it.
The constructive signal is the gap itself. Institutional demand ran above $200 million a session while social enthusiasm sat at a fraction of its July level, which means the marginal buyer is allocating on mandate rather than on momentum, and mandate-driven flows do not reverse on a 5% pullback. Meanwhile the 50-day average at $68,167 is rising steeply toward the 200-day at $69,541. A crossover in the coming weeks, the first since May, would draw in systematic capital that reads neither sentiment surveys nor Twitter.

 en.bitcoinsistemi.com
 en.cryptonomist.ch

 news.bitcoin.com
