


Bitcoin price extended its sharp recovery on Aug. 21, rising above $76,000 for the first time since late May as institutional inflows and improving U.S. liquidity conditions supported the breakout.
$BTC traded near $76,291, gaining almost 9% over 24 hours and approximately 19% during the previous seven days, according to crypto.news price data. The rally lifted $BTC by more than $11,000 in roughly 48 hours.
The move began after $BTC rebounded from the $62,000 to $63,000 region and broke through resistance around $65,000. It then cleared $70,000, paused near $72,000 and advanced through $75,000.
Bitcoin price ends weeks of sideways trading
The crypto had spent about six weeks trading inside a narrow range, with repeated attempts to move beyond $65,000 failing. The lack of direction encouraged traders to build bearish positions around the upper boundary.
Momentum changed on Wednesday when $BTC climbed through several resistance levels within hours. Forced short covering accelerated the advance as traders bought $BTC to close leveraged bearish positions.
As previously reported, almost $3 billion in positions were liquidated as $BTC crossed $70,000. Shorts accounted for most of the liquidations, according to CoinGlass data cited by analysts.
The liquidations explain part of the rally’s speed but not necessarily its direction. Spot demand and U.S. exchange traded fund inflows also increased as $BTC moved higher.
ETF inflows provide evidence of institutional demand
U.S. spot Bitcoin ETFs recorded approximately $606 million in net inflows on Aug. 20, according to SoSoValue data. The total followed about $517 million of inflows on Aug. 19.
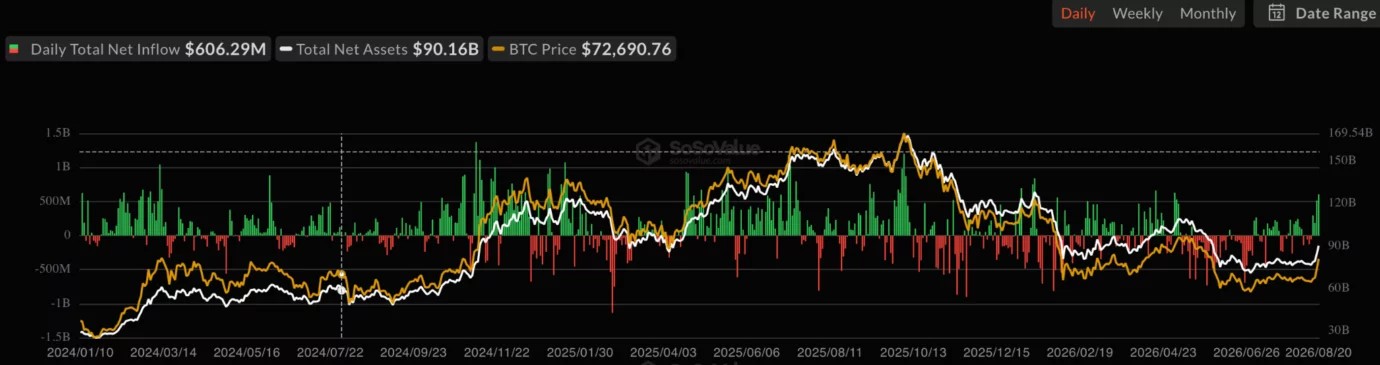
The two sessions produced more than $1.1 billion in combined net buying. The acceleration suggests institutional investors participated in the breakout rather than leaving the move entirely to derivatives traders covering short positions.
Spot Ether ETFs separately attracted about $221 million on Aug. 20. XRP funds added approximately $13 million, while Solana products received around $15 million.
In related coverage, analysts warned that continued ETF and spot demand will determine whether Bitcoin can establish lasting support above $70,000. Short covering provides temporary buying pressure because it ends once bearish positions have been closed.
The next ETF flow reports will therefore be closely watched. Continued inflows into next week would strengthen the case that institutions are adding exposure after the breakout. A rapid slowdown would leave the advance more dependent on momentum traders.
U.S. Treasury decision improves the liquidity backdrop
The U.S. Treasury Department announced on Aug. 19 that it will at least double the maximum size of liquidity support buybacks for longer dated government securities.
The maximum size will increase from $2 billion to at least $4 billion per operation. The change takes effect on Sept. 9 and will remain in place through Nov. 4, according to the department’s official announcement.
Long term Treasury yields declined after the decision, while the U.S. dollar weakened. Lower bond yields can make volatile assets more attractive because investors receive less income from government securities.
The buybacks should not be described as direct stimulus for Bitcoin. The Treasury said the program is intended to improve liquidity in longer dated bond markets. It does not create central bank money or directly purchase cryptocurrency.
U.S. political developments added to market sentiment. President Donald Trump urged Congress to pass a “fair version” of the Digital Asset Market Clarity Act during an Aug. 19 White House event involving crypto executives and federal regulators.
Trump also discussed the possibility of expanding U.S. Bitcoin holdings. However, the administration has not announced a purchase, funding mechanism or implementation timeline. Any acquisition therefore remains uncertain.
Bitcoin price faces an overheated momentum reading
The daily $BTC/USDT chart shows Bitcoin trading well above its former $60,000 to $66,000 consolidation range. Volume near 13,610 $BTC was higher than several recent sessions, supporting the breakout.
The Awesome Oscillator stood near 3,448 and moved firmly into positive territory. The reading indicates that short term momentum has strengthened compared with the recent sideways period.
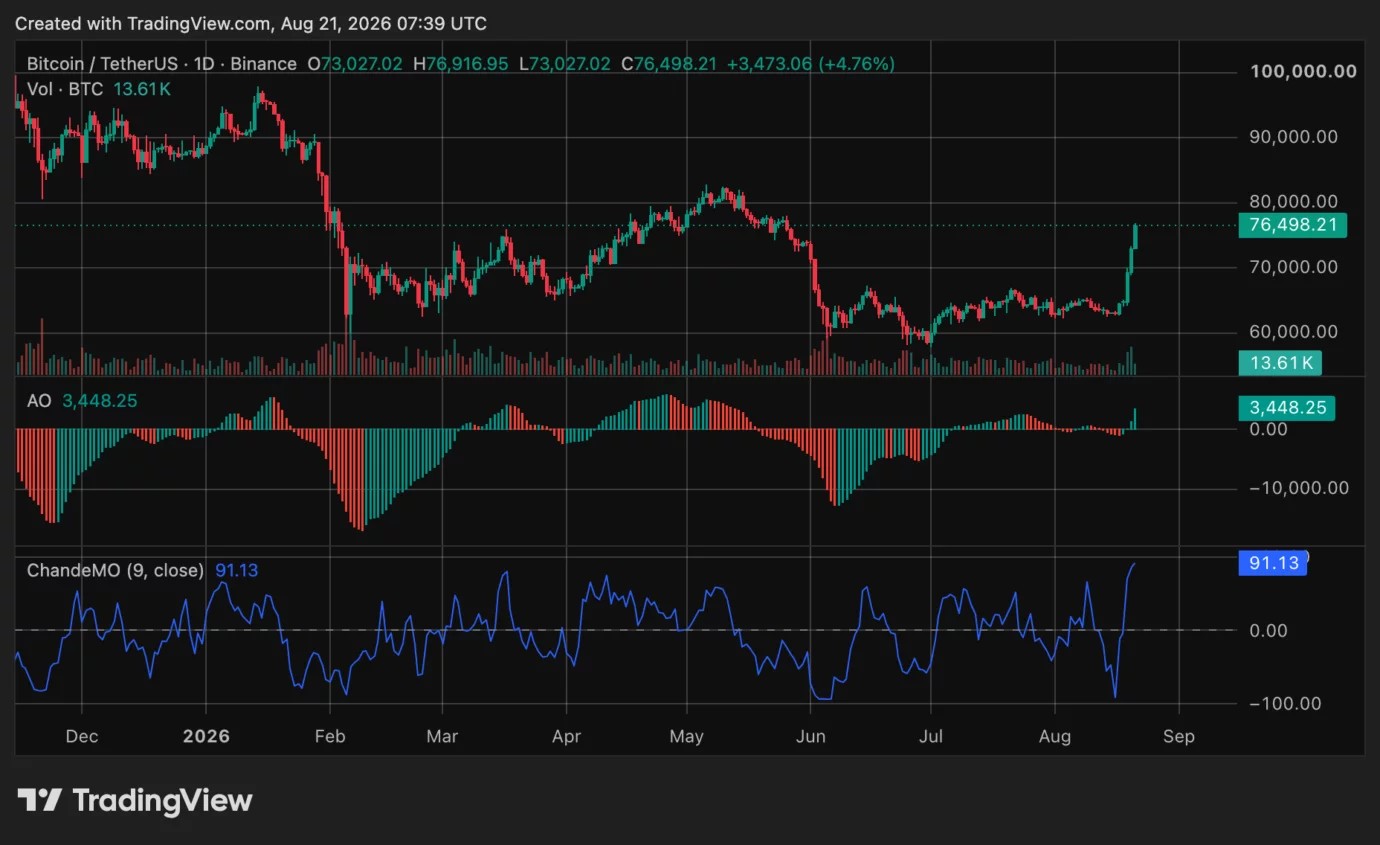
The Chande Momentum Oscillator reached approximately 91.13. A reading that elevated signals strong buying pressure, but it also suggests that Bitcoin may be temporarily overheated after its rapid advance.
The earlier breakout placed the $65,000 to $67,000 area in focus as a deeper retest zone. The more immediate support area has since moved toward $70,000 to $72,000.
Holding above that range would preserve the current bullish structure. The next major resistance sits around $80,000 to $82,000, where Bitcoin previously faced selling pressure.
A weekly close above $75,000 would provide stronger confirmation than an intraday move. Failure to hold $70,000 could expose $BTC to a larger retracement after an 18% advance in two days.

 bitcoinworld.co.in
 news.bitcoin.com