


 1
1
Bitcoin has strengthened its short-term structure after breaking above several resistance levels and closing above its 200-day simple moving average for the first time since November, according to two trader charts. $BTC now faces a key test around $70,500, while the $67,000-$67,200 area has emerged as the main support bulls need to defend.
Bitcoin Flips 4-Hour Structure as $70,500 Becomes the Next Test
Bitcoin has pushed sharply higher from the $63,000 support area, reclaiming several levels that previously blocked attempts to recover. The four-hour chart shared by That Martini Guy shows $BTC approaching a major resistance zone after breaking out of its recent trading range.
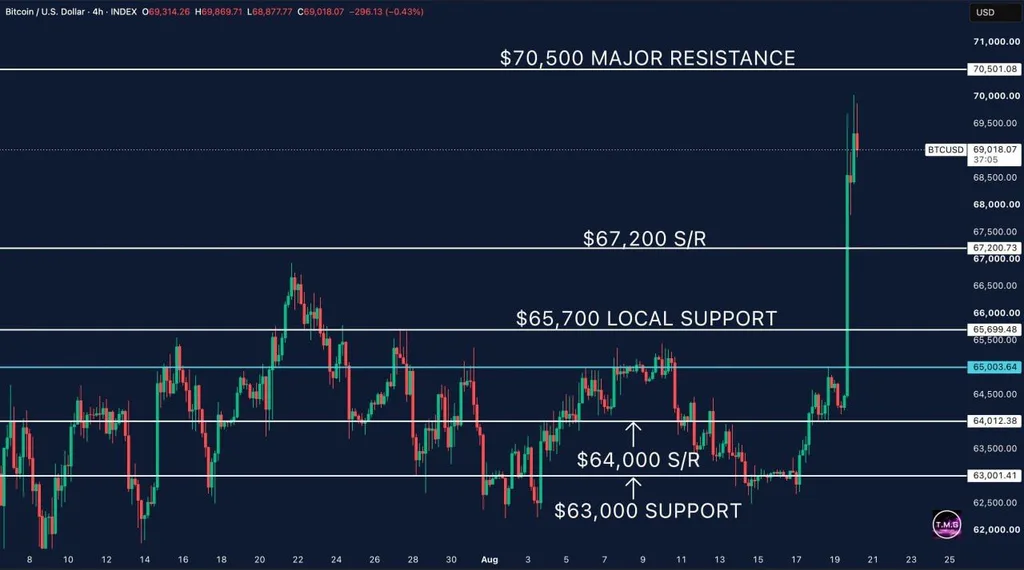
Bitcoin 4-Hour Chart With $67,200 Support. Source: MartiniGuyYT on X
The chart shows Bitcoin near $69,018 after a strong advance that briefly brought price close to $70,000. The trader identifies $70,500 as the main resistance level standing in the way of another leg higher.
More important for the short-term structure, $BTC has reclaimed $64,000, $65,700 and $67,200. Those areas previously acted as resistance during Bitcoin's consolidation and could now serve as support if the breakout holds.
The $67,200 area is particularly important. That Martini Guy said maintaining that level would allow pullbacks to be viewed as normal consolidation rather than evidence that the breakout has failed.
If buyers defend $67,200, another challenge of $70,500 would remain in play. A clean break and hold above that resistance could bring $71,500 and $72,000 into focus under the trader's scenario.
The downside is equally clear. Losing $67,200 would weaken the breakout and expose $65,700, followed by $64,000 and the larger $63,000 support area.
$BTC Closes Above 200-Day SMA, but Weekly Confirmation Still Matters
Bitcoin has also crossed a closely watched longer-term trend indicator, adding another bullish signal to the recent rally. A daily chart shared by trader Sykodelic shows $BTC closing above its 200-day simple moving average after a sharp move from the mid-$60,000 range.
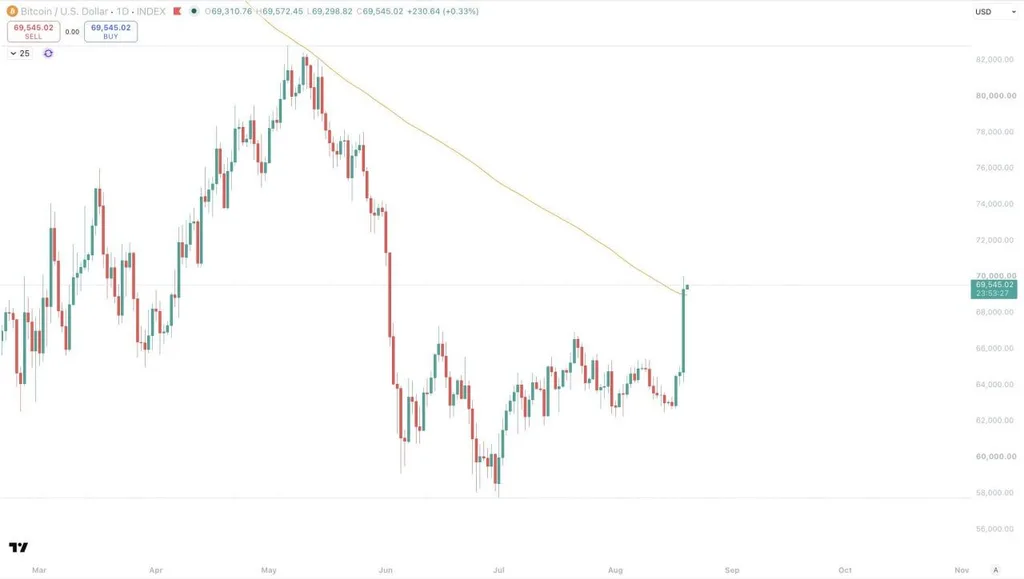
The chart shows Bitcoin around $69,545 after a large daily candle pushed price through the descending 200-day SMA.
Sykodelic said it was Bitcoin's first daily close above the indicator since November. The trader also argued that similar reclaims have historically appeared around major changes in Bitcoin's broader market trend.
That historical interpretation should be treated as the trader's view rather than confirmation that a new bull market has begun. One daily close above a moving average can improve the technical picture, but price still needs to remain above the level to show that buyers have established control.
Sykodelic is also waiting for the weekly close before treating the breakout as confirmed. That adds importance to the next several sessions because a move back below the 200-day SMA could turn the latest surge into a failed breakout.
The two charts point to a similar level for invalidation. Sykodelic highlighted $67,000 as the area bulls should continue holding, while the four-hour setup places key support at $67,200.
That makes the $67,000-$67,200 zone the clearest near-term line for Bitcoin. Holding above it would preserve the improved structure and keep $70,500 in focus. A break below it would weaken the bullish setup and increase the risk of a deeper pullback toward the mid-$60,000 area.

 news.bitcoin.com
 bitcoinmagazine.com
 bitcoinworld.co.in
 en.cryptonomist.ch