


 1
1
Bitcoin price is trading near $63,000 after repeated failures above $65,000, with US spot Bitcoin ETF outflows and weakening short-term price action keeping $BTC under pressure.
According to SoSoValue data, US spot Bitcoin ETFs recorded about $131 million in net outflows on August 13, extending a run of withdrawals that has reduced one of Bitcoin's main sources of buying demand in recent sessions.
ARK 21Shares' ARKB led the latest withdrawals with roughly $58.8 million in net outflows. A day earlier, the funds lost another $61.1 million, including about $46.8 million from Fidelity's FBTC.
The selling followed an uneven start to the week. Spot Bitcoin ETFs posted $144.6 million in net outflows on August 10, followed by just $7.8 million of inflows on August 11 before withdrawals resumed over the next two sessions.
With ETF demand weakening, Bitcoin has struggled to hold its recent highs. CoinGecko data showed $BTC trading around $63,173 on August 14, down about 1.6% over the past seven days.
Price action over the same period shows $BTC trading above $65,000 several times between August 8 and August 10 before the market turned lower.
Bitcoin lost $64,500 on August 11, and subsequent rebounds have repeatedly stalled below $64,500, leaving the price close to $63,000.
US inflation data provided some relief but failed to reverse the decline. July headline inflation eased to 3.4% from 3.5%, while core inflation fell to 2.5% from 2.6%.
Bitcoin initially moved higher after the release as the softer figures reduced immediate pressure on the Federal Reserve to tighten monetary policy.
The reaction faded quickly, however, and $BTC remained unable to establish itself above $64,000.
The failure left the $64,000 to $65,000 area as the main obstacle separating Bitcoin from another attempt at $65,000.
Recent price action has also kept $BTC inside the range that has largely contained it between roughly $62,000 and $66,000.
Liquidation positioning adds another level traders may have to contend with before a recovery develops.
See below:
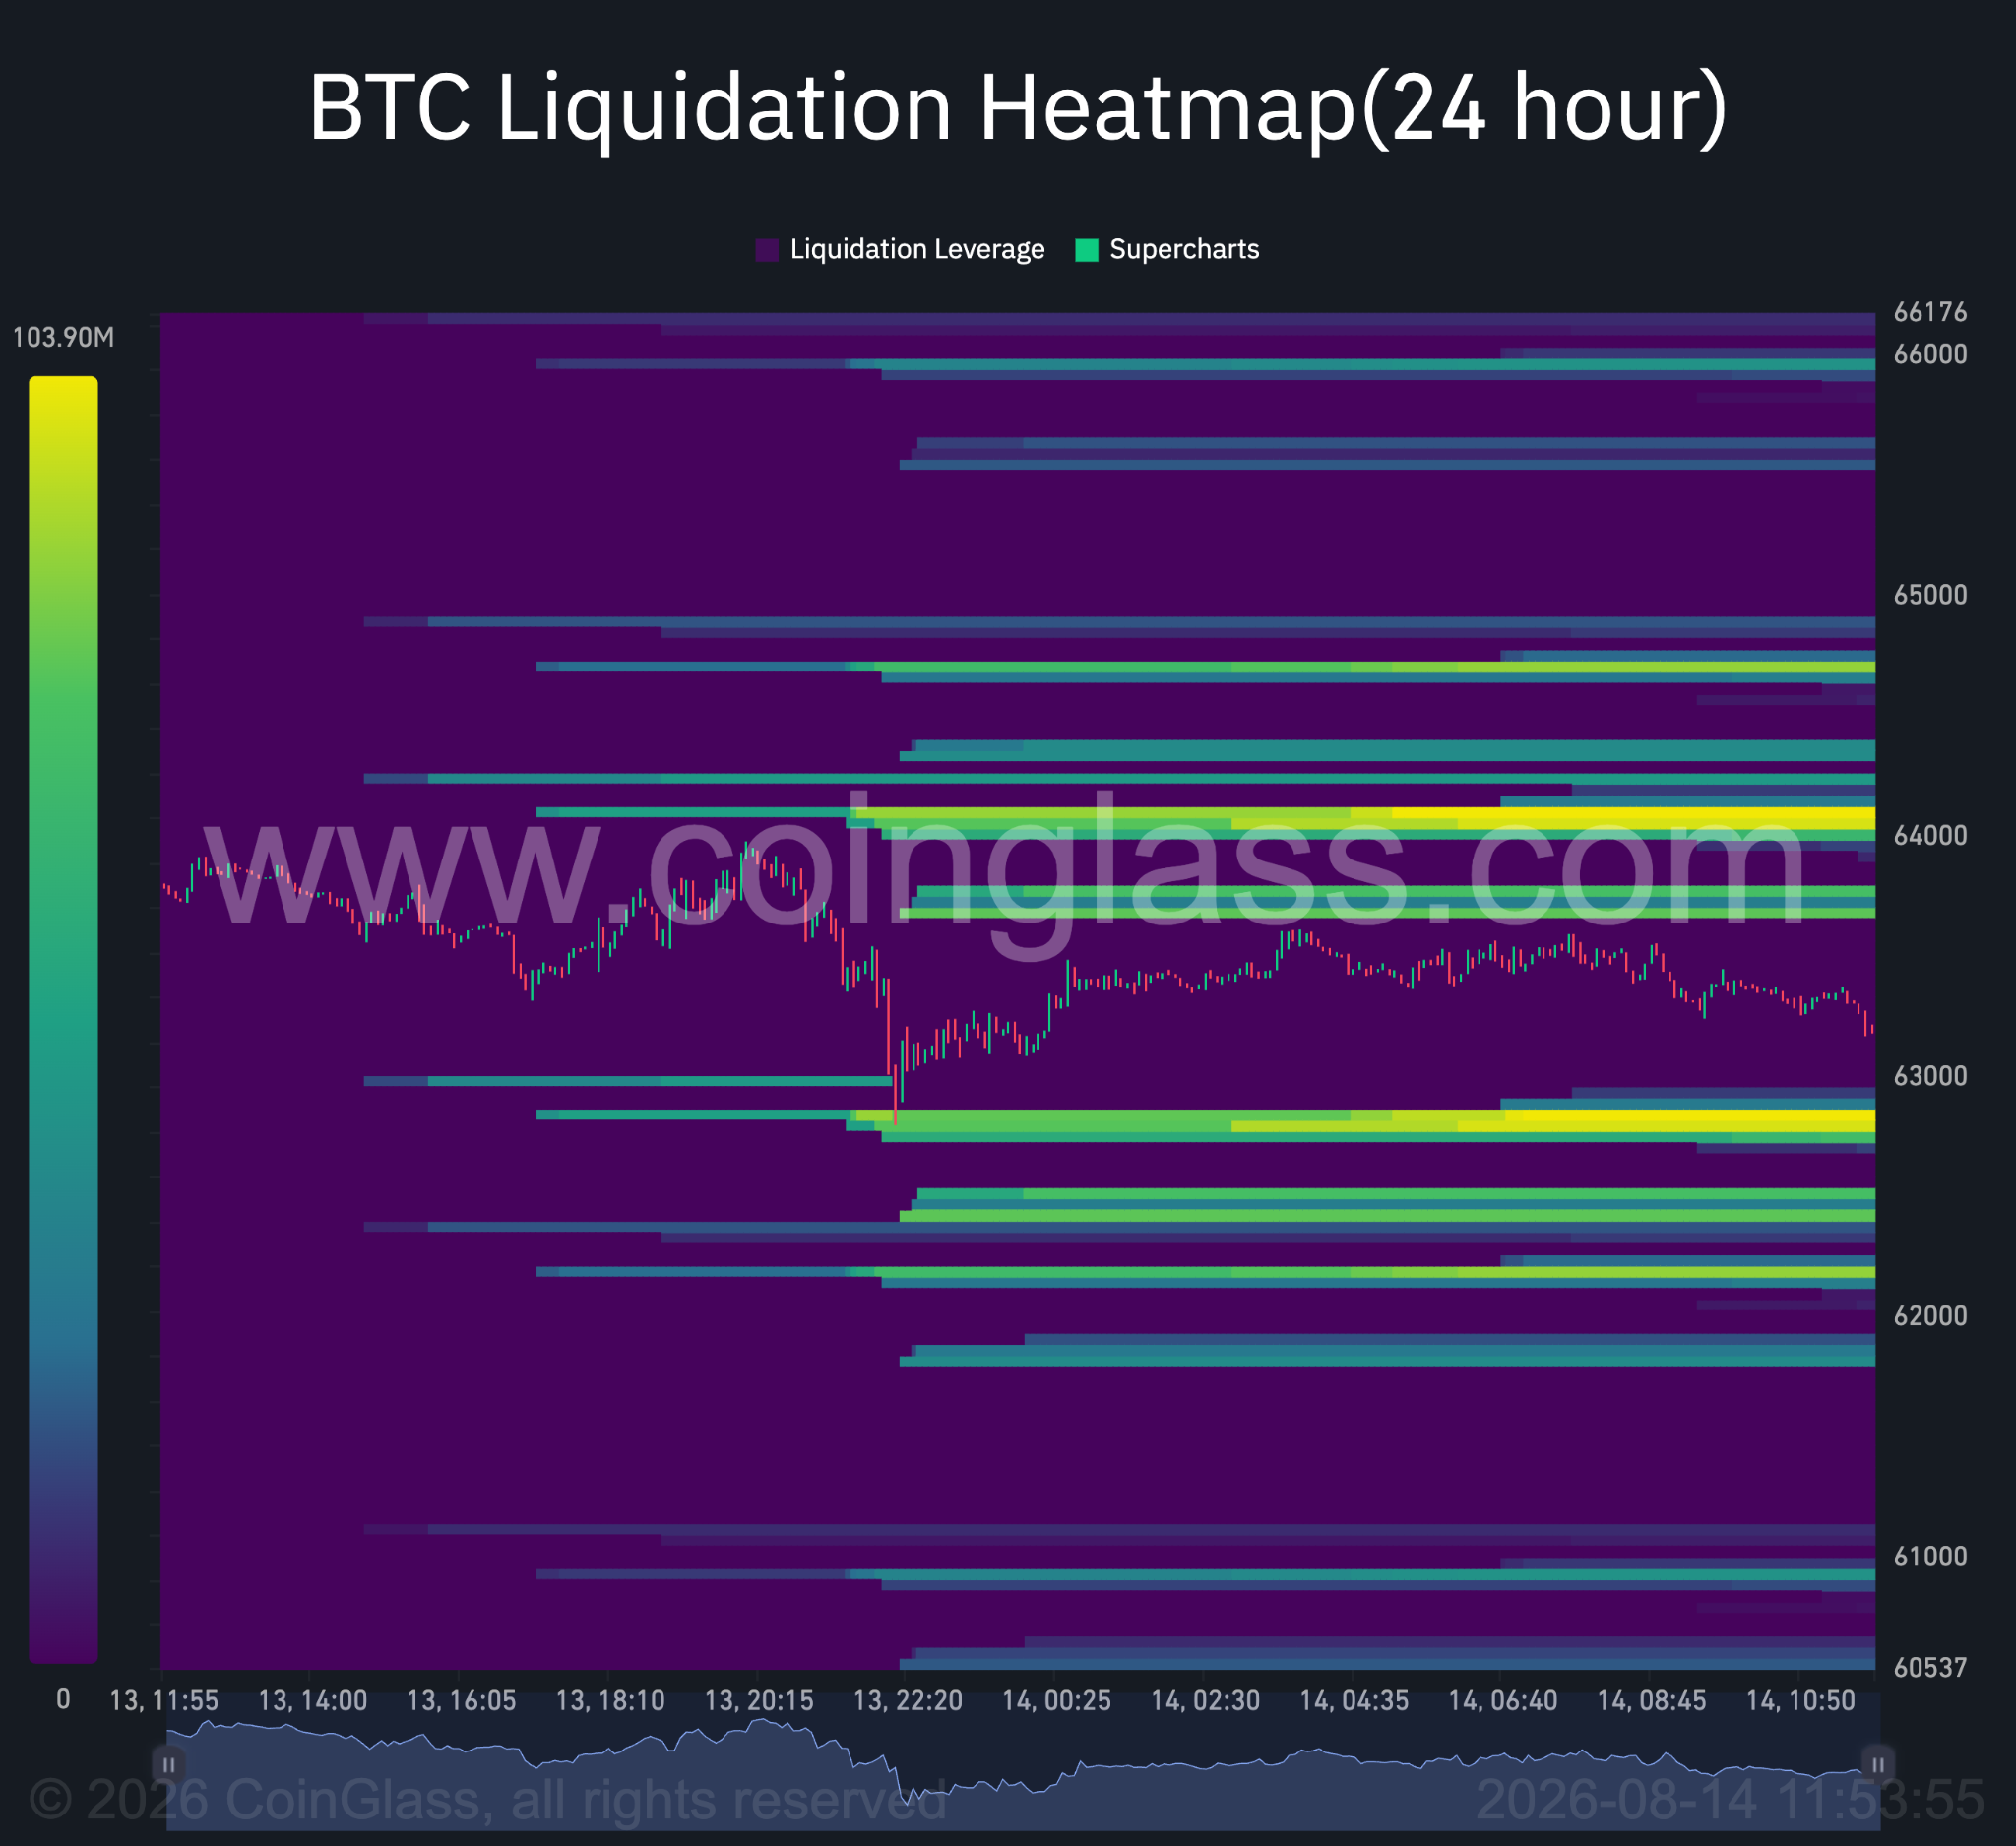
Bitcoin 24-hour liquidation heatmap. Source: Coinglass.
CoinGlass' 24-hour Bitcoin liquidation heatmap from August 14 showed a large concentration of leveraged positions around $62,750 to $62,900, just below the current price.
Another pocket sits around $62,300 to $62,500. Above spot, the heatmap shows sizeable concentrations around $63,700 to $64,050 and another strong band near $64,500 to $64,650.
The positioning leaves liquidity on both sides of $BTC, but the closest large concentration is below $63,000.
A further decline could therefore put the $62,800 area in focus before Bitcoin gets another chance to challenge the liquidity sitting above $64,000.
$BTC price analysis
Bitcoin's daily chart shows that the path back to $65,000 remains difficult despite momentum reaching oversold levels.
On the daily TradingView chart, $BTC was trading around $63,133 on August 14 after falling below three anchored VWAP levels at approximately $63,415, $64,024 and $64,634.
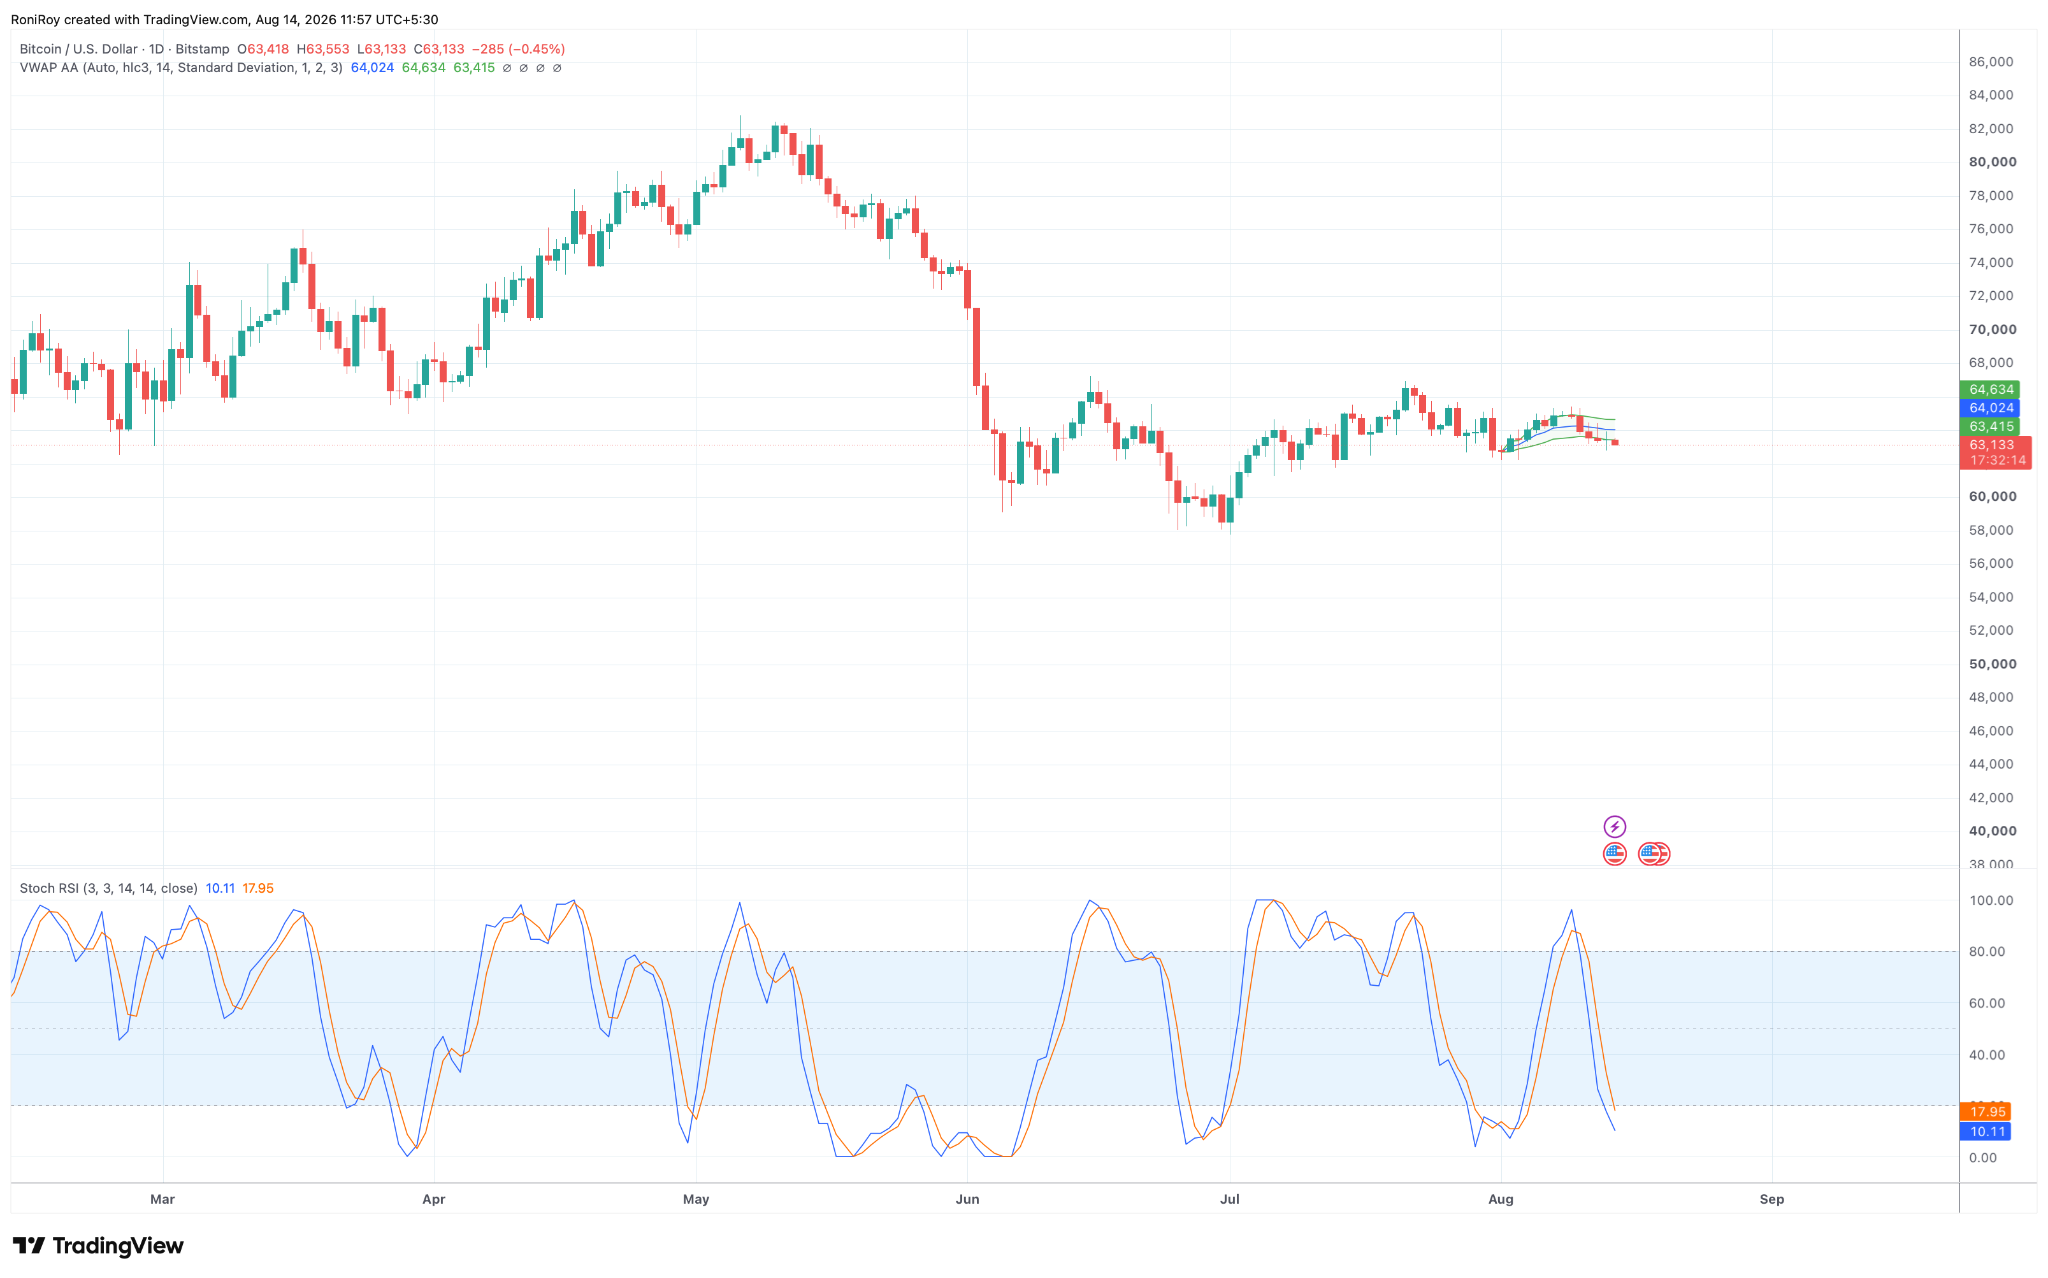
$BTC/USD 1-day price chart. Source: TradingView.
With all three now above the market, Bitcoin has several resistance levels to recover before $65,000 comes back into play.
The first test sits around $63,400. A move above it would put the second anchored VWAP around $64,024 in focus, which also lines up with the heavy liquidation concentration around $63,700 to $64,050 on the CoinGlass heatmap.
Clearing that area would leave the third anchored VWAP at roughly $64,634 as the next hurdle.
The heatmap places another large liquidation cluster around $64,500 to $64,650, making that zone particularly important for any attempt to reach $65,000.
Momentum on the daily chart, however, leaves room for a rebound. The Stochastic RSI has dropped deep into oversold territory, with the %K line at 10.11 and %D at 17.95.
Such readings show that the latest decline has pushed short-term momentum toward the lower end of its recent range, although the indicator has not yet produced a confirmed bullish turn.
A recovery in the Stochastic RSI alongside a move back above the anchored VWAP levels would improve the case for another test of $65,000.
Without that price confirmation, the oversold reading alone does not establish that the decline has ended.
The 4-hour chart gives $62,800 added importance if selling continues.
See below:
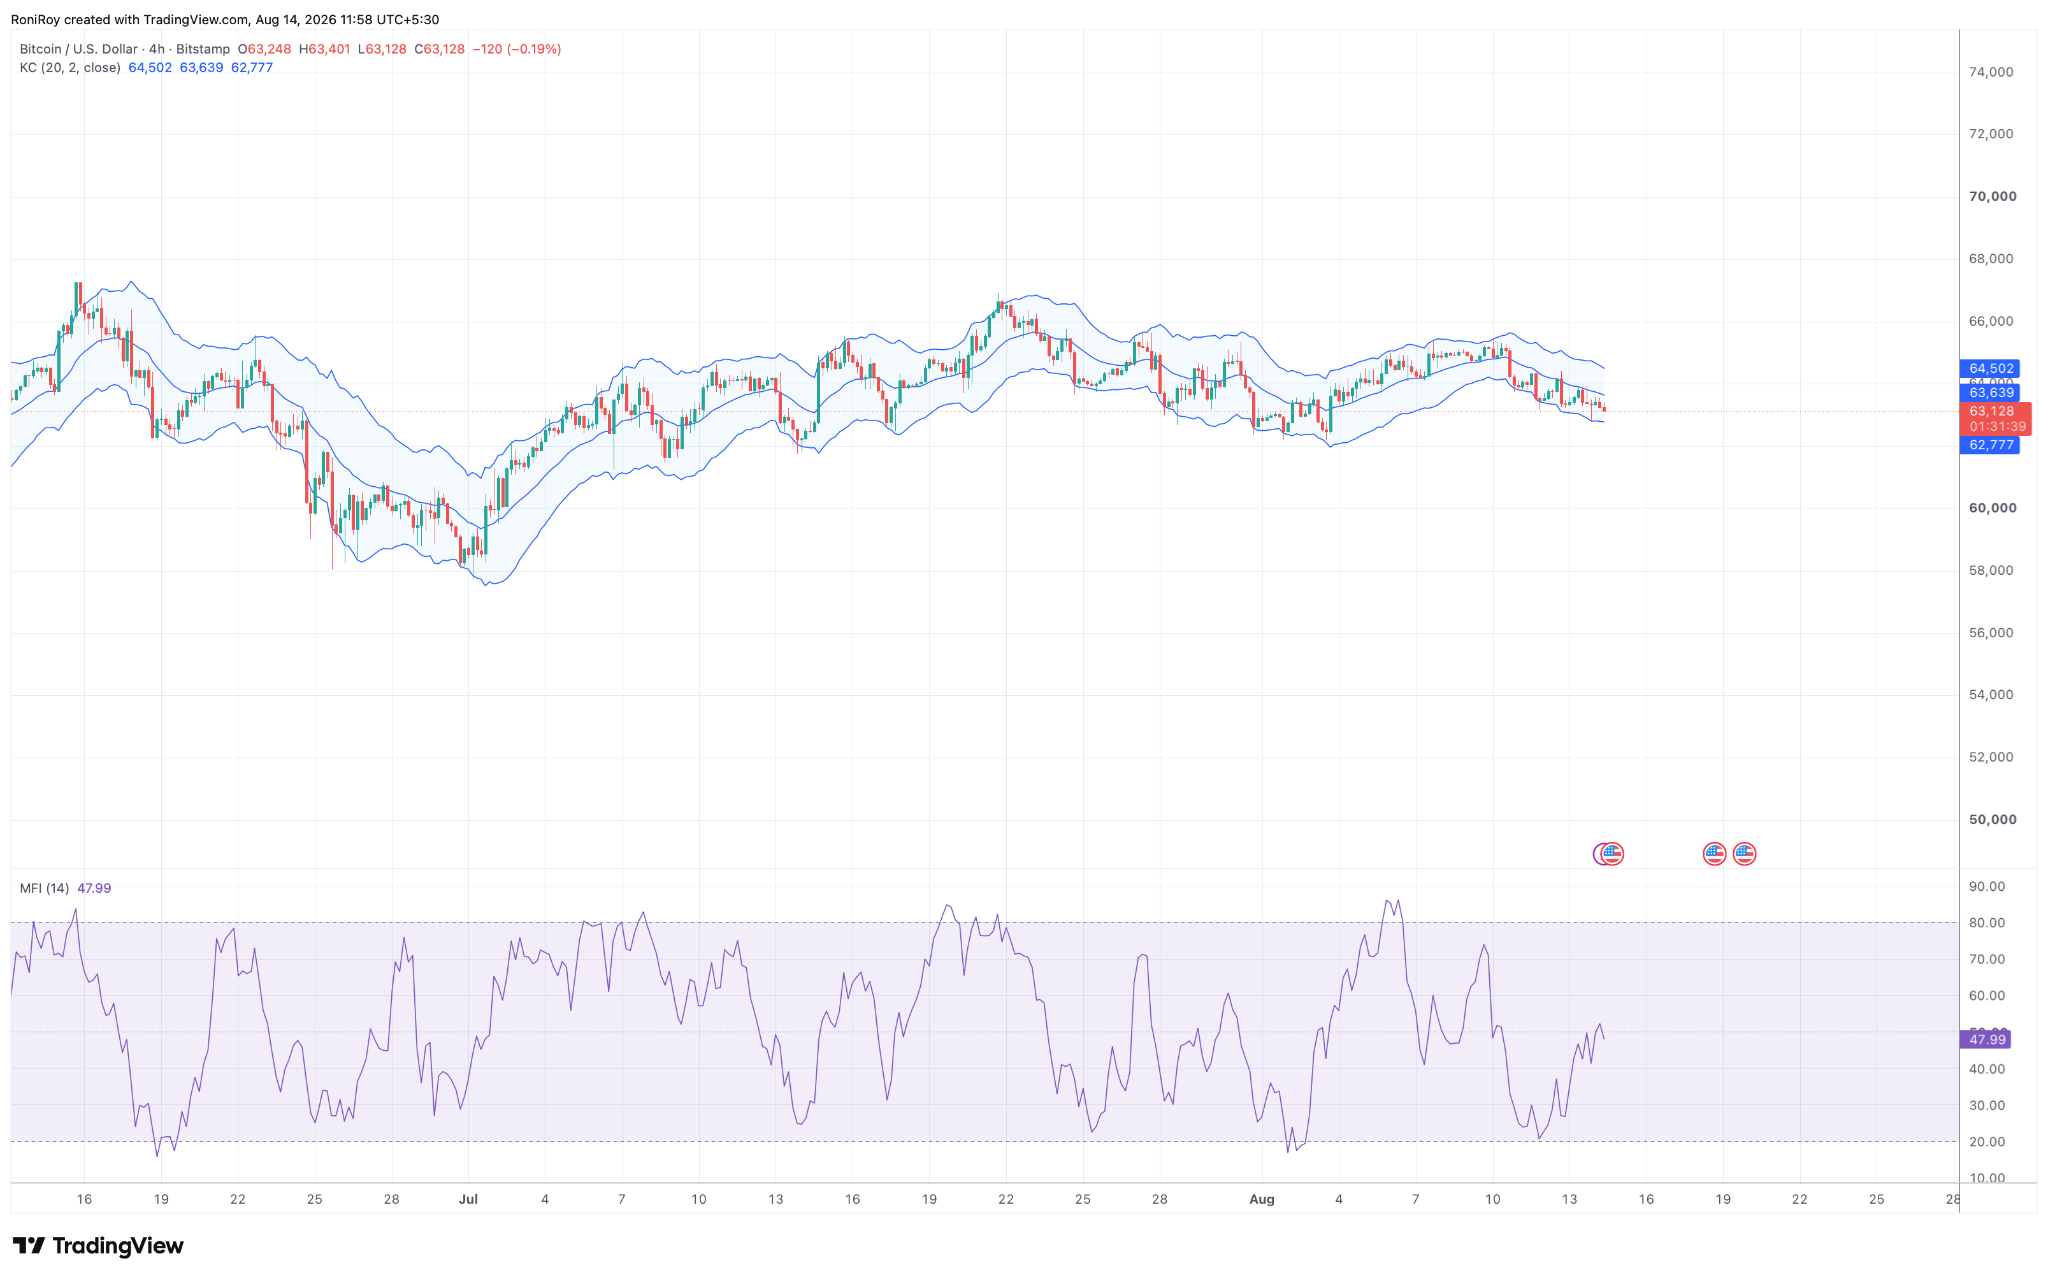
$BTC/USD 4-hour price chart. Source: TradingView.
Bitcoin was trading around $63,128, below the Keltner Channel basis at $63,639 and not far above its lower band at $62,777. The upper Keltner band stood around $64,502.
That lower band almost overlaps with the $62,750 to $62,900 liquidation cluster shown by CoinGlass.
If $BTC loses $63,000, the combination places roughly $62,800 as the first downside target, followed by the $62,300 to $62,500 liquidity area and the larger $62,000 support zone.
The 4-hour Money Flow Index stood at 47.99, having recovered from levels close to oversold territory.
A reading near 50 shows neither strong buying nor selling pressure, leaving Bitcoin without a clear money-flow advantage as it trades near the lower half of the Keltner Channel.
For the upside, the 4-hour setup puts $63,639 at the first recovery level. Above it, the $64,000 area becomes the next test before the Keltner upper band around $64,502.
A break through $64,500 to $64,650 would clear both the upper Keltner area and one of the largest nearby liquidation clusters on the heatmap, opening a direct test of $65,000.
If buyers can establish $BTC above $65,000, the recent seven-day price action leaves the $65,500 to $66,000 region as the next area to watch.
On the downside, failure to defend the lower Keltner band around $62,777 would expose $62,500 and $62,000, with the latter sitting near the bottom of Bitcoin's recent trading range.

 en.bitcoinsistemi.com
 coinedition.com