



 17
17
Bitcoin is consolidating near the mid-$60,000s as technical charts place $69,000-$70,000 as the key bullish reclaim zone and roughly $57,000 as critical downside support. A break above resistance could improve $BTC’s weekly structure, while renewed weakness toward $57,000 would strengthen the risk of a deeper bear-market move toward lower support levels.
Bitcoin Repeats Prior Bear-Market Pattern as $57K Becomes Critical Support
Gum (@gumsays) argues that Bitcoin is tracking a pattern similar to its previous bear-market cycle, with $BTC falling below a major monthly moving average and then struggling to reclaim it. The chart suggests that failure to hold the $57,000 area could expose Bitcoin to deeper downside levels around $53,000, $49,000 and $45,000.
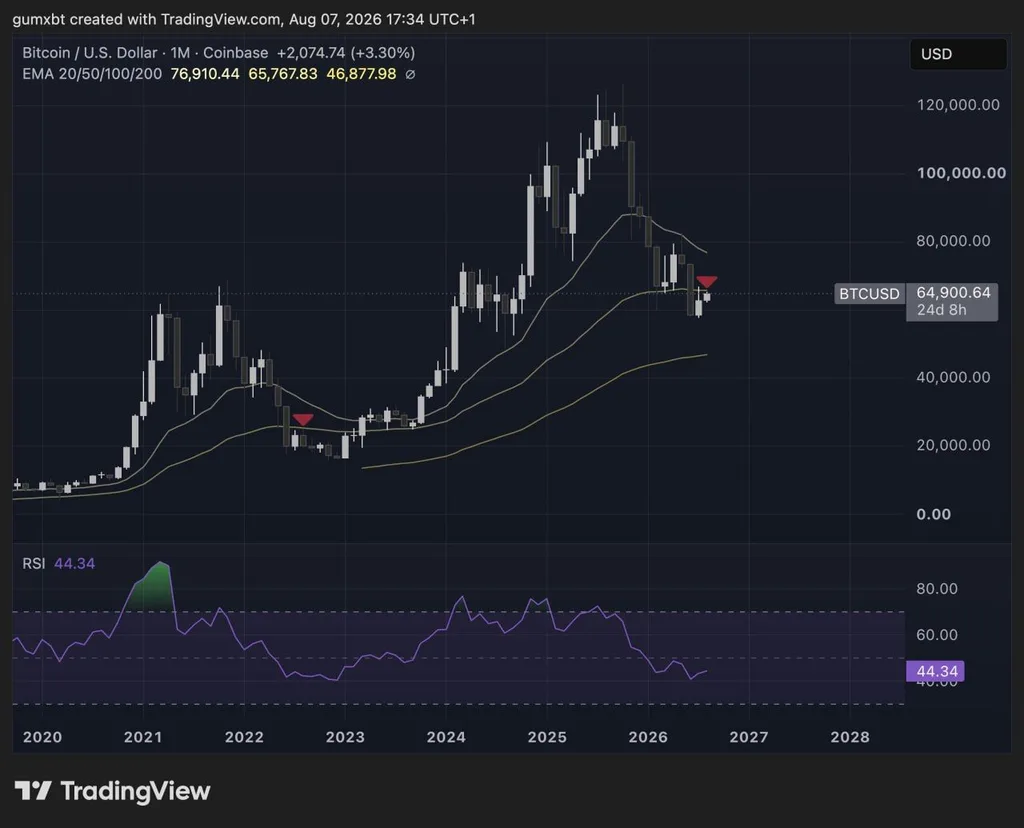
Bitcoin Monthly Bear-Market Cycle. Source: gum (@gumsays) on X
The monthly $BTC/USD chart places Bitcoin near $64,900 and compares the current structure with the 2022 bear market. Red markers highlight what the analyst sees as similar rejection points following breaks below an important long-term trend indicator.
The chart itself uses exponential moving averages. Its displayed 50-month EMA sits near $65,768, leaving Bitcoin slightly below that level at the time of the screenshot. Gum describes the setup as a break below the "50 Monthly MA" followed by a retest one month later that failed to produce a sustained recovery.
That rejection is central to the bearish comparison. During the previous cycle, Bitcoin remained under pressure after losing its long-term moving-average structure before eventually reaching a broader market bottom. Gum believes the current market could follow a comparable sequence: a temporary grind higher into mid-August followed by renewed selling and a slower decline over the following months.
However, the later stages of that path remain a scenario rather than confirmed price action. Historical patterns can resemble one another without producing identical outcomes, and Bitcoin would need additional weakness to confirm that the previous bear-market structure is repeating.
Momentum also remains cautious. The monthly RSI is shown at 44.34, below the neutral 50 level but above traditionally oversold territory. That indicates weaker momentum without showing the kind of extreme reading that, by itself, would establish a market bottom.
The analyst identifies $57,000 as the key downside level. Gum argues that another visit to that area could lead to a breakdown and fresh lows. Below $57,000, the levels highlighted in the commentary are $53,000, $49,000 and $45,000, which represent possible areas to watch if selling pressure accelerates.
For the bearish thesis to weaken, Bitcoin would first need to reclaim the moving-average area around $65,768 and then build a stronger monthly recovery. Conversely, a sustained break below $57,000 would strengthen the analyst's cycle-repeat scenario and bring the lower price zones into greater focus.
Bitcoin Compression Tightens as $69K-$70K Becomes the Bullish Reclaim Zone
Daan Crypto Trades sees Bitcoin approaching a decisive technical point as several major weekly indicators converge near $69,000. The chart suggests $BTC needs to reclaim that resistance cluster and close into the $70,000s to materially improve its broader market structure.
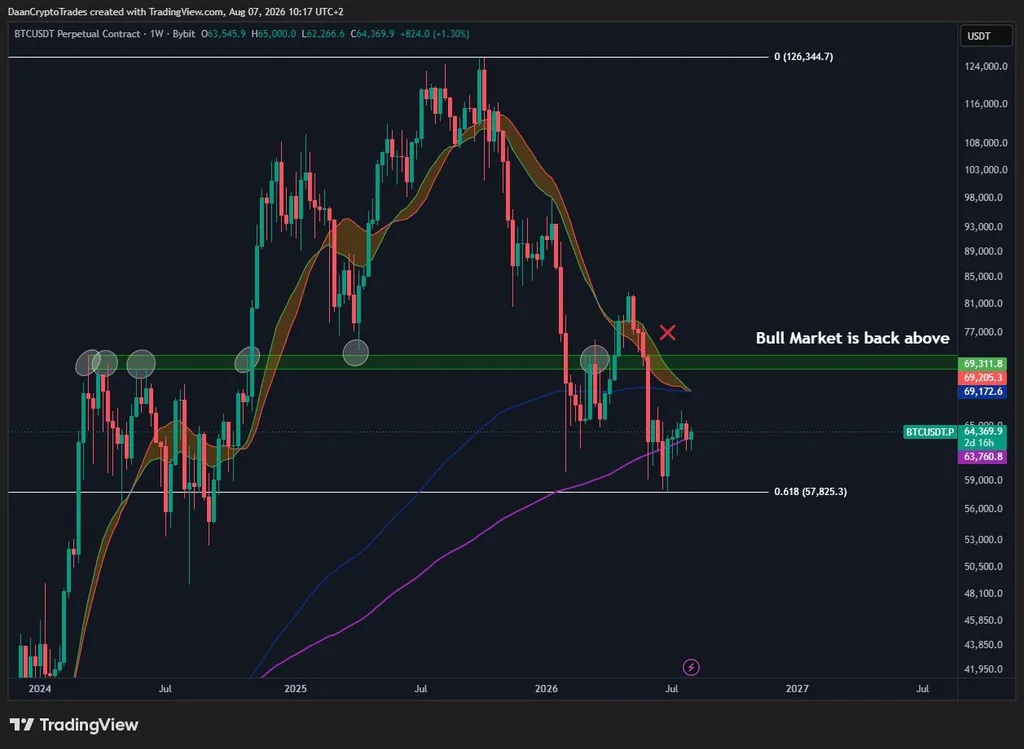
Bitcoin Weekly Compression. Source: Daan Crypto Trades on X
The weekly $BTC/USDT chart shows Bitcoin near $64,370, caught between long-term support below and a dense resistance zone overhead. The most important area sits around $69,000, where Daan says the bull-market support band and weekly 200-day-equivalent EMA structure are lining up.
The chart labels levels near $69,172, $69,205 and $69,312, creating a narrow resistance cluster rather than a single breakout point. That concentration makes the $69,000-$70,000 region especially important: a brief intraday move above it would be less convincing than a sustained weekly close.
According to Daan, weekly closes into the $70,000s would be the clearest bullish signal. Such a move would put Bitcoin back above the highlighted support band and long-term EMA, weakening the bearish structure that has developed since $BTC fell from its higher levels.
Until then, price remains compressed. Bitcoin is also hovering close to its weekly 200-period moving average, displayed near $63,761 on the chart. Daan notes that $BTC has formed marginally higher lows over recent weeks, suggesting buyers are still defending the lower end of the current range.
That makes the setup increasingly binary. Holding the weekly 200-period moving average while reclaiming $69,000 could shift momentum toward buyers, with $70,000-plus closes serving as stronger confirmation. Failure to break the resistance cluster, however, would leave $BTC vulnerable to another test of lower support.
The chart marks $57,825 as the deeper downside level, corresponding to the 0.618 Fibonacci retracement shown on the setup. A move back toward that area would reinforce the downside risk highlighted in the first Bitcoin chart, where roughly $57,000 was also identified as a crucial threshold.
For now, Bitcoin remains trapped between support near the mid-$60,000s and resistance around $69,000-$70,000. The increasingly tight range suggests a larger directional move could follow, but the breakout direction still needs confirmation.

 en.bitcoinsistemi.com
 coindesk.com
 cryptopotato.com
 beincrypto.com