



 14
14
Bitcoin is showing significant price stability after the recent bearish pressure that saw it fall below $58,000 for the first time in 20 months. TradingView data shows the cryptocurrency traded at $63,823 at the time of writing, reflecting a 10% recovery from the $57,735 yearly low it recorded about one month ago.
The current $BTC price also reflects an approximately 50% pullback from the cryptocurrency’s all-time high of $126,198 achieved in October 2025. However, the price is locked in a tight consolidation range as institutional outflows compete against long-term holder accumulation.
Bitcoin’s Technical Perspective (Fibonacci)
From a technical perspective, Bitcoin remains heavily wedged with massive upside potential. The Fibonacci structure on the cryptocurrency’s daily chart shows price resting on a crucial 0.236 Fibonacci support level.
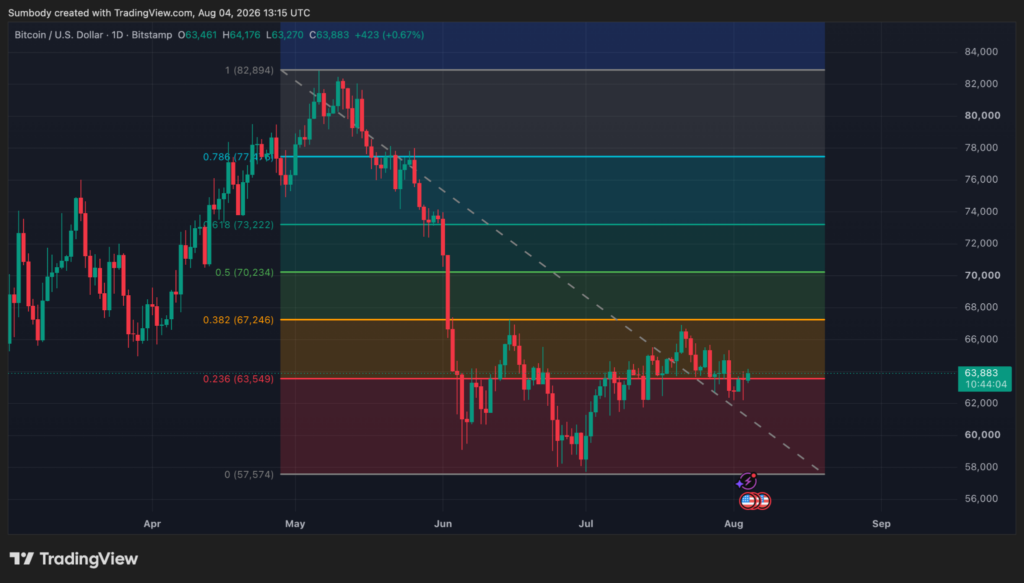
BTCUSD Daily Chart on TradingView
Bitcoin’s price action around this support highlights its importance in the current scheme of things. The closest resistance highlighted by the indicator is around $67,200, and Bitcoin needs to break above that level to establish a strong case for a bullish narrative.
Fundamental and On-Chain Factors
A review of fundamental and on-chain factors reveals that spot Bitcoin ETFs ended July with a positive net inflow of $172.4 million. While these structural inflows establish a higher price floor than in previous halving cycles, they have simultaneously correlated Bitcoin more closely with traditional risk assets. This has resulted in a divergence, with $BTC facing headwinds from a strong US dollar despite soaring equities.
Bitcoin has maintained stable internal block metrics and network difficulty, preserving the protocol’s core value proposition. However, exogenous market events continue to shock short-term price discovery. The recent Coldcard exploit led to a $70 million drain from storage, introduced localized selling pressure, and negatively affected investor sentiment.
$BTC Forecasts and Actionable Strategy
Bitcoin price forecasts, particularly among institutional establishments, have heavily moderated compared to the exaggerated targets set in late 2025. Standard Chartered has revised its Bitcoin 2026 target to $150,000, citing slower corporate adoption. Fandstrat maintains a range of $150,000 to $200,000, assuming spot ETFs represent a permanent shift in asset allocation.
Considering the prevailing trend, long-term spot Bitcoin allocators seem to be adopting a Dollar-Cost Averaging (DCA) model, especially while Bitcoin trades within the $58,000 to $63,000 zone. Chasing breakout spikes under the current situation is risky, and traders are adopting a cautious approach until order book liquidity confirms a structural shift.

 en.bitcoinsistemi.com
