


 1
1
Bitcoin’s second rejection from $67,000 has increased short-term downside risk as its weekly stochastic RSI signals a potentially prolonged bottoming phase. Failure to reclaim resistance could expose $62,000, $60,000 and $58,000, while the projected $45,000-$55,000 cycle-low zone remains speculative.
Bitcoin’s Oversold Signal Points to a Longer Bottoming Process
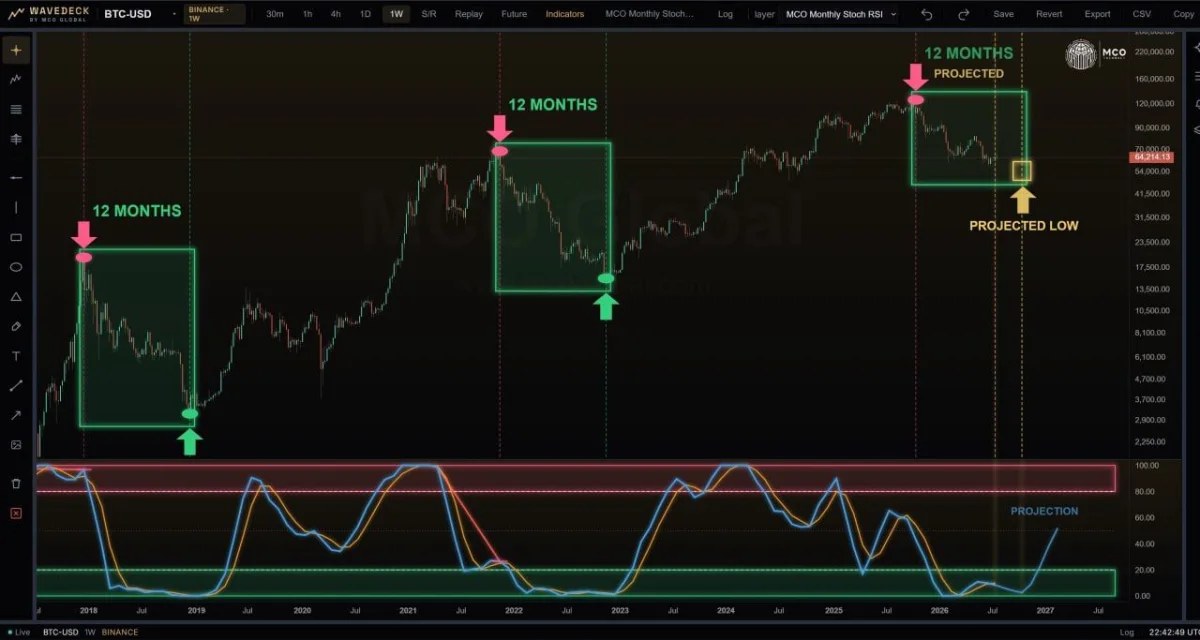
Bitcoin’s weekly stochastic RSI has entered oversold territory, but the signal may not mark an immediate market bottom. More Crypto Online said previous cycles remained oversold for several months before Bitcoin established its final bear-market low.
$BTC weekly chart. Source: More Crypto Online/Wavedeck
The chart compares Bitcoin’s current structure with the 2017-2018 and 2021-2022 market cycles. In both cases, the stochastic RSI dropped into its lower range while price continued declining or consolidating before reaching a broader cycle bottom.
The analyst’s projection suggests the current bottoming phase could extend into late 2026. The chart places a possible low around the $45,000-$55,000 region, although the exact level and timing remain speculative.
Previous cycles took roughly 12 months to move from the major peak into the final low. Applying the same pattern to the latest cycle supports the possibility of continued volatility and further downside before a sustained recovery begins.
However, an oversold stochastic RSI does not guarantee that Bitcoin must fall further. The indicator measures momentum rather than fair value, and it can remain depressed while price consolidates or begins recovering.
For now, the setup points to a prolonged bottoming process rather than a confirmed reversal. Bitcoin would need to hold major support and establish a clear sequence of higher highs and higher lows before the longer-term outlook improves.
Bitcoin Faces Renewed Sell-Off Risk After Second $67,000 Rejection
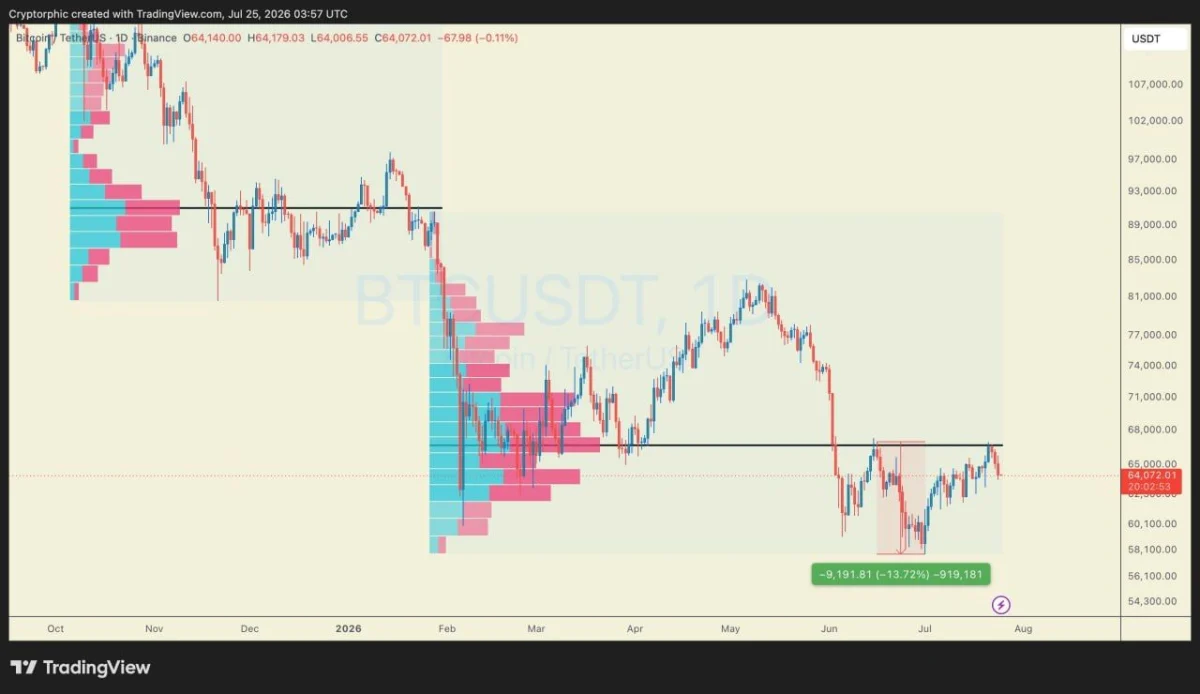
Bitcoin has been rejected for a second time near the $67,000 Point of Control, raising the risk of another sharp decline. Analyst Cryptorphic noted that the previous rejection from the same area preceded a 13% drop, making the level critical for $BTC’s short-term direction.
$BTC daily chart. Source: Cryptorphic/TradingView
The Point of Control marks the price level where the highest trading volume occurred within the displayed range. Bitcoin’s repeated failure to reclaim this area suggests sellers remain active near $67,000.
The chart shows $BTC retreating toward $64,000 after the latest rejection. Continued trading below $67,000 would preserve the local bearish structure and could shift attention toward support around $62,000 and $60,000.
A stronger decline could expose the late-June low near $58,000. The previous move from $67,000 to that area represented a drop of almost 14%, although the same outcome is not guaranteed.
However, the bearish scenario would weaken if Bitcoin breaks above $67,000 and holds the level as support. That could invalidate the rejection and reopen the path toward $71,000 and higher resistance.
For now, $67,000 remains the main decision level. Failure to reclaim it keeps downside pressure active, while a confirmed breakout would signal that buyers have regained control.

 cryptopolitan.com


 coinedition.com
 cryptopotato.com

 thecryptobasic.com