



 13
13
Bitcoin may still push into the $66,000-$72,000 resistance area, but the rebound continues to look corrective. A rejection after sweeping the highs could send $BTC back toward $60,000-$61,000, while holding above $72,000 would weaken the bearish setup.
Bitcoin Could Fake a Breakout Above $65,600 Before Falling Toward $60,000
Bitcoin may first push above the equal highs near $65,600, attracting breakout buyers before reversing lower. The chart treats that move as a possible liquidity sweep rather than the beginning of a rally toward $68,000-$70,000.
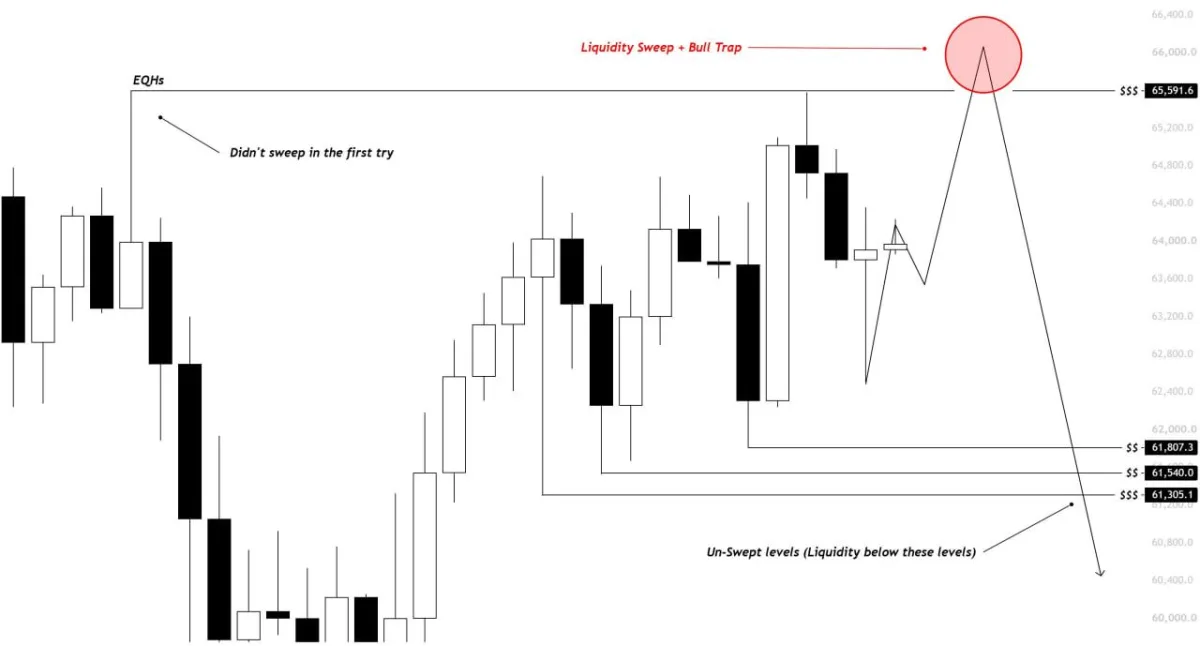
$BTC chart. Source: Kaz/X
The highs near $65,600 remain unswept, making them a natural short-term target. A brief break above that level could trigger stop orders and pull late buyers into the market, providing liquidity for larger sellers.
However, several untouched liquidity levels remain below at roughly $61,807, $61,540 and $61,305. If Bitcoin sweeps the highs and quickly falls back below $65,600, those lower levels could become the next targets, followed by the broader $60,000-$61,000 region.
The rounded structure near the recent highs also supports the lower-high scenario. Still, the bearish setup needs confirmation through a rejection and loss of nearby support; a sustained move above $65,600 would weaken the bull-trap case and open the way toward higher resistance.
Bitcoin Rally Remains Corrective as Major Resistance Looms
Bitcoin’s rebound from the late-June low remains corrective rather than the start of a confirmed bullish trend, according to More Crypto Online. Price has recovered toward $64,750, but the wider structure still lacks the strength needed to overturn the previous decline.
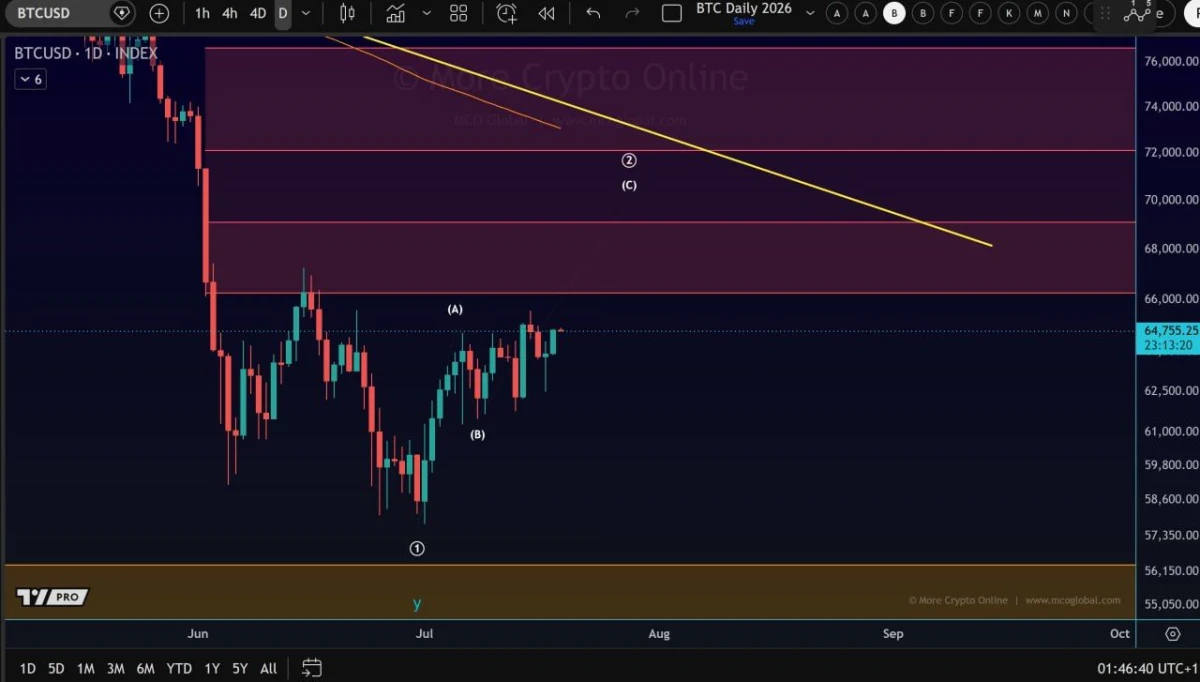
$BTC daily chart. Source: More Crypto Online/X
The chart labels the recovery as an ABC correction, with the first advance forming wave A and the following pullback forming wave B. Bitcoin may still complete wave C higher, but that move would remain part of the correction unless price breaks major resistance and changes the larger structure.
The first barrier sits around $66,000, where earlier rebounds lost momentum. Above that, the chart highlights resistance near $69,000 and $72,000, while a descending trendline adds pressure around the same area.
A move into the $69,000-$72,000 region could complete the corrective rally before sellers return. However, a strong daily breakout above the trendline and sustained trading above $72,000 would weaken the bearish interpretation.
Until that happens, the recovery remains vulnerable to another rejection. Losing nearby support around $62,500 could return attention to $61,000 and then the late-June lows near $58,000.


 coindesk.com
 1
1
 bitcoinworld.co.in
