


 1
1
 4
4
Bitcoin continued its recovery this week, climbing toward an important resistance zone after rebounding from its recent swing low near $57,700. The world’s largest cryptocurrency traded around $64,300, reflecting stronger buying interest after weeks of pressure. While short-term momentum has improved, traders still face several technical barriers before confirming a broader trend reversal.
Resistance Levels Hold the Key
Bitcoin currently trades above its 20-day exponential moving average, signaling improving short-term strength. However, it remains below the 50-day, 100-day, and 200-day moving averages. Consequently, buyers must reclaim these levels before the broader market shifts into a stronger bullish phase.
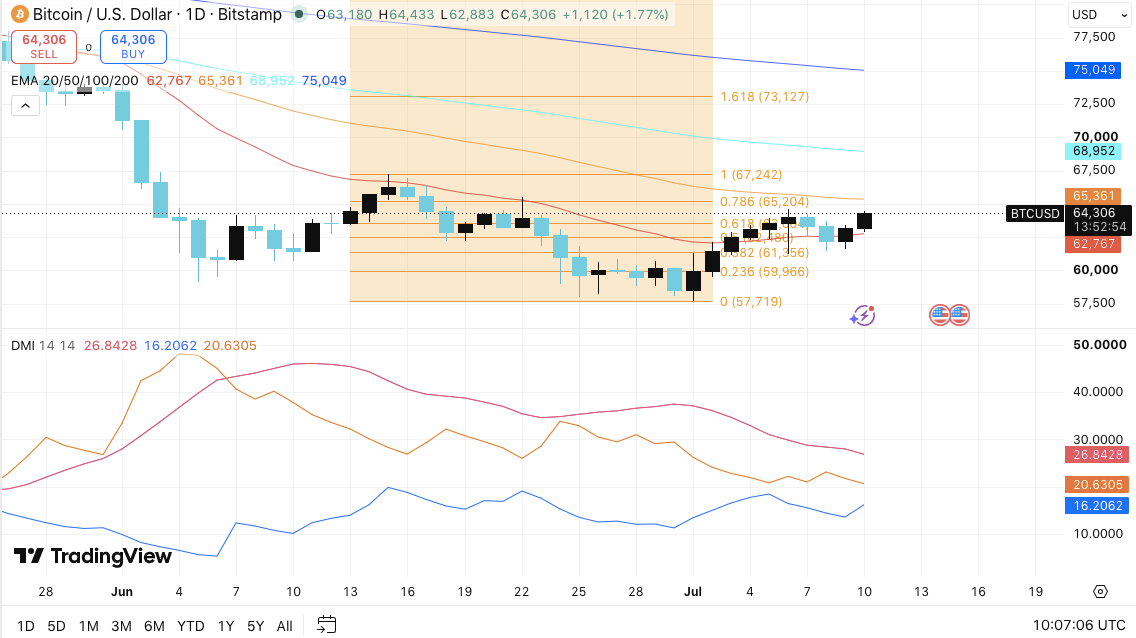
The immediate resistance sits near $64,500, followed by the 0.786 Fibonacci retracement around $65,200. Additionally, the 50-day EMA near $65,360 creates another significant hurdle. A successful breakout above this area could drive Bitcoin toward $67,200 and later $69,000. Beyond that, the 200-day EMA near $75,000 remains the primary long-term target.
Support levels also remain well defined. The 20-day EMA around $62,800 now serves as the first defensive zone.
Besides that, Fibonacci support levels near $61,800, $61,300, and $60,000 could limit downside pressure. Losing those areas would expose the previous swing low near $57,700.
The Directional Movement Index also reflects a changing market structure. Bears maintain a slight advantage because the negative directional indicator remains above the positive reading.
Related: Ethereum Price Prediction: Can ETH Extend Its Rally Toward $1,955?
However, the gap continues narrowing, showing that selling momentum has weakened considerably. Moreover, the ADX near 27 suggests the current trend still carries meaningful strength.
Derivatives and Exchange Data Reflect Cautious Optimism
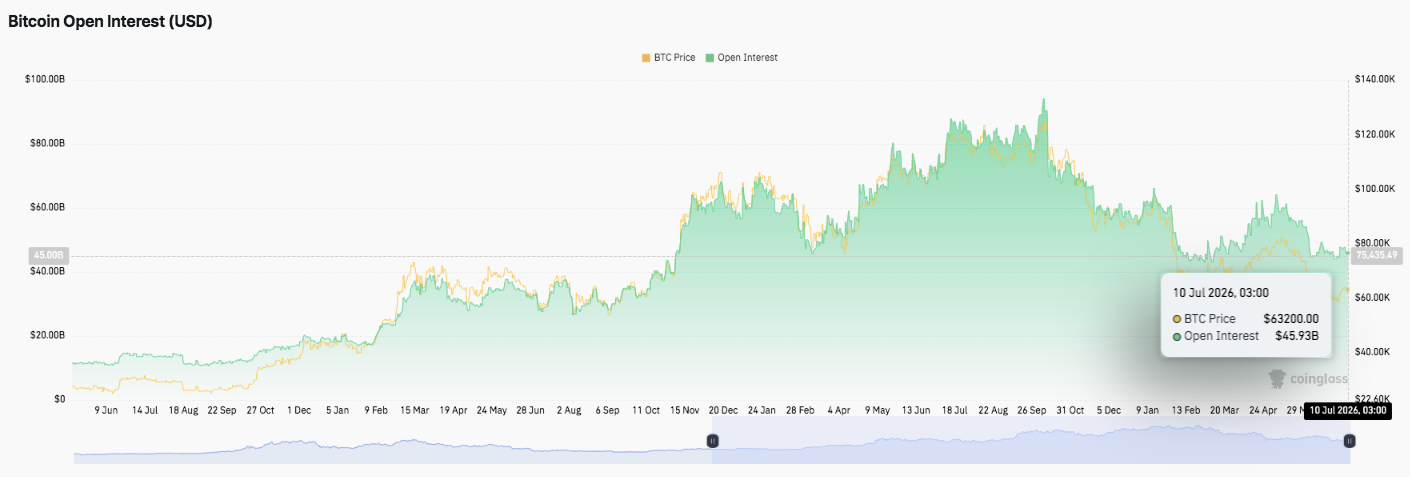
Bitcoin’s derivatives market has cooled noticeably during recent weeks. Open interest has declined from above $90 billion to roughly $45.9 billion. This reduction suggests traders have closed leveraged positions through liquidations and profit-taking. Nevertheless, current levels remain comfortably above historical lows, highlighting continued institutional and retail participation.
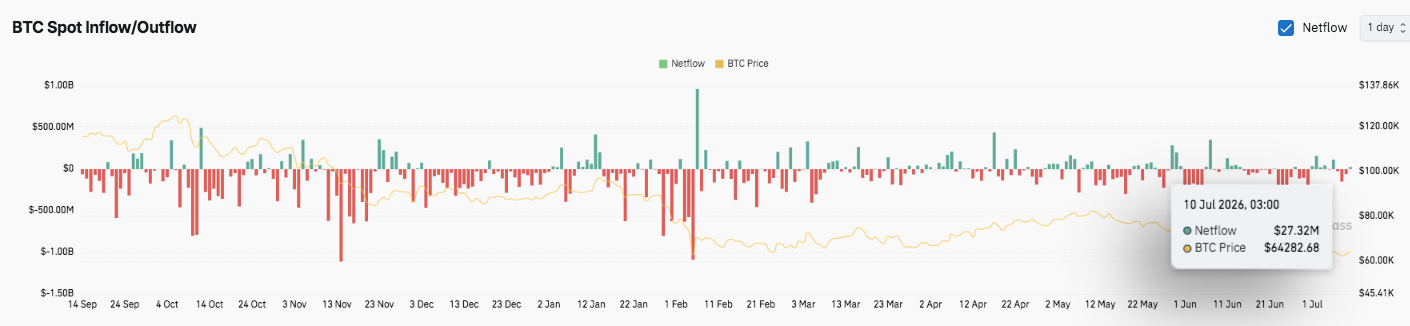
Spot exchange activity also paints a balanced picture. Earlier periods recorded heavy withdrawals, including several exceeding $500 million and one surpassing $1 billion. Those movements pointed toward accumulation as investors transferred Bitcoin into private wallets. More recently, exchange flows have stabilized with smaller inflows and outflows.
Related: $XRP Price Prediction: Is $XRP Setting Up a 1,000% Move or Just Retesting the Same Resistance?
The latest net inflow of roughly $27 million indicates limited selling activity rather than aggressive distribution. Hence, Bitcoin appears to be entering a consolidation phase, where stronger demand could fuel the next directional move.
Technical Outlook for Bitcoin Price
Key levels remain firmly in focus as Bitcoin attempts to strengthen its recovery:
Upside levels: $64,480 is the first resistance, followed by the critical $65,204-$65,361 breakout zone. A sustained move above this area could accelerate gains toward $67,242, with $68,952 (100-day EMA) and $73,127 emerging as the next upside objectives.
Downside levels: Initial support sits at $62,767 (20-day EMA), followed by $61,826 and $61,356. If selling pressure intensifies, Bitcoin could revisit $59,966, while $57,719 remains the key swing low that bulls must defend.
Resistance ceiling: The 100-day EMA at $68,952 remains the major barrier before Bitcoin can challenge the long-term resistance at the 200-day EMA near $75,049.
The broader technical structure shows Bitcoin recovering from recent lows while trading between major moving averages. Momentum has improved, but confirmation of a sustained bullish reversal requires a decisive break above the $65,200-$65,400 resistance cluster.
Will Bitcoin Go Up?
Bitcoin’s near-term outlook depends on whether buyers can convert the $65,200-$65,400 resistance zone into support. A successful breakout, accompanied by rising open interest and stronger spot demand, could pave the way for a rally toward $67,200 and $69,000, with higher targets coming into focus afterward.
However, failure to overcome this resistance could trigger another period of consolidation or a pullback toward $62,800, with $61,300 and $60,000 serving as the next key support zones.
Related: Velvet Price Prediction: Velvet Price Jumps 30% as Bulls Eye $0.54 Breakout
Exchange flows indicate selling pressure has eased, while declining open interest suggests excessive leverage has been flushed from the market. Together, these factors point to a healthier market structure, although Bitcoin still needs stronger buying conviction to confirm the next sustained advance.

 cointelegraph.com
 cryptopotato.com
 coinpedia.org