



 4
4
Bitcoin trades at $62,741.45 on July 8, down 0.92%, after getting rejected at the top of its descending channel even as ETF inflows turned positive for a third straight session.
Is $BTC Getting Rejected At The Channel Top Again?
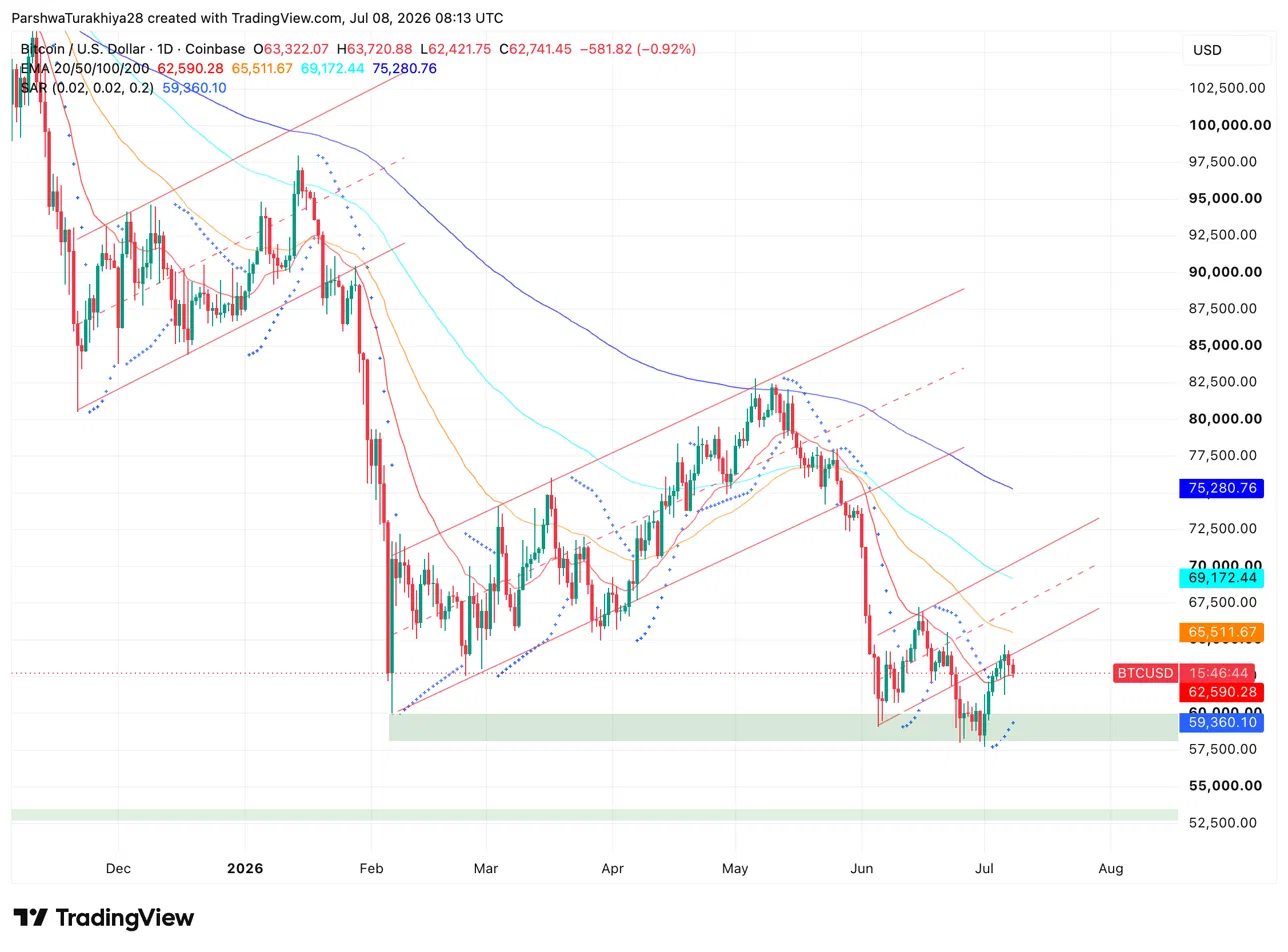
The daily chart shows $BTC inside a descending channel that has broken down three times in 2026, with price currently pressing against the upper trendline after recovering from the June 25 low near $58,000. Analyst Ali Charts flagged the rejection explicitly, noting $BTC is getting turned away at the channel’s upper boundary and identifying $59,700 as the immediate pullback target and $56,550 as the next downside level if that doesn’t hold.
Related: Ethereum Price Prediction: Bulls Target $1,802 Breakout While Sellers Remain Active
The Parabolic SAR at $59,360.10 remains below price, keeping the short-term recovery structure intact for now. All four EMAs sit above spot: the 20-day at $62,590.28 is essentially at current price, the 50-day at $65,511.67, the 100-day at $69,172.44 and the 200-day at $75,280.76 overhead.
What Are The Key Support And Resistance Levels For $BTC Today?
- Support at $59,700 on the channel mid-point and $59,360 on the SAR
- Resistance at $62,590 on the 20-day EMA and the channel’s upper trendline near $63,700
Why Do Three Straight ETF Inflows Matter For Bitcoin?
US spot Bitcoin ETFs recorded $21.44M in net inflows on July 7, the third consecutive day of positive flows following $265.69M on July 6 and $221.72M on July 2. That three-day streak is the first since May 4, 5 and 6, breaking an eight-week run of outflows that drained more than $8.6 billion from the funds.
BlackRock’s IBIT led July 7 with $54.80M, though Fidelity’s FBTC saw $24.92M in outflows and ARK’s fund lost $8.44M, keeping the net total modest. Cumulative inflows across all funds now stand at $51.37B with total net assets at $77.26B. Three days doesn’t confirm a trend reversal, but the prior streak ending in early May preceded a rally to $83,000, giving bulls a historical reference point even if the macro backdrop is considerably noisier now.
How Are US-Iran Tensions Affecting Bitcoin’s Price?
Iran’s Revolutionary Guards struck US military sites in Bahrain and Kuwait overnight after the US launched a wave of strikes against Iran in response to tanker attacks in the Strait of Hormuz. Brent crude jumped 3.3% to $76.59 a barrel on the news while the dollar firmed to its highest level in a week.
Related: Pi Network Price Prediction: Will Backend Storage Drive Enough Demand to Keep PI Above Its Key Trendline
Risk assets tend to struggle when geopolitical uncertainty spikes alongside a stronger dollar, and crypto is no exception. Analysts at DBS noted markets appear to be treating the exchange of strikes as tactical positioning ahead of the mid-August ceasefire expiry rather than a full return to open conflict, which limits the immediate damage but keeps the risk premium elevated.
What Do $BTC Derivatives Show About Current Positioning?
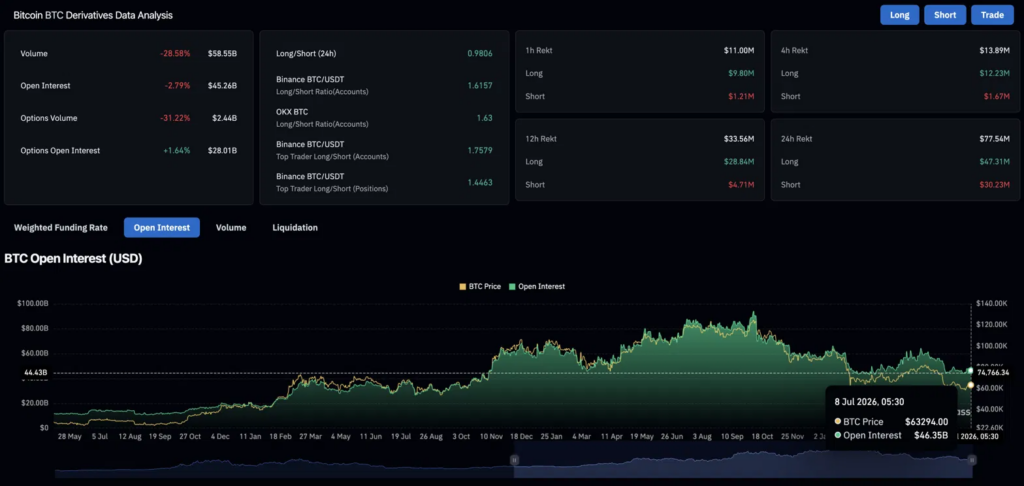
Volume fell 28.58% to $58.55B while open interest dropped 2.79% to $45.26B, both declining together as traders step back. Liquidations over 24 hours hit $77.54M, longs losing $47.31M against $30.23M for shorts, showing buyers who chased the recovery are getting caught on the pullback.
The long/short ratio at 0.9806 is near balanced, with neither side in clear control at current levels.
Bitcoin Price Prediction: Upside and Downside Targets
- Upside case: The ETF inflow streak extends to four days, the channel top breaks on volume, and $BTC targets $65,511 on the 50-day EMA as the next recovery milestone.
- Downside case: The channel rejection holds, geopolitical risk keeps dollar strength elevated, and $BTC pulls back to $59,700 as Ali Charts flagged, with $56,550 as the deeper target if that fails.
Related: Shiba Inu Price Prediction: Can Robinhood’s 109M SHIB Burn Break the Triangle Before It Breaks Down

 coinpedia.org
 u.today
 finbold.com