


 7
7
Bitcoin is trying to recover after its latest drop, with traders watching whether the $58,000 support area can hold. RSI, MACD and liquidation data now point to the same zone: Bitcoin needs to reclaim resistance above $61,800 before a stronger move toward $63,600 becomes realistic.
Bitcoin Eyes $63,600 as RSI and MACD Point to Possible Bounce
$BTC shows a possible short-term bounce setup, but the chart does not confirm a bullish reversal yet.
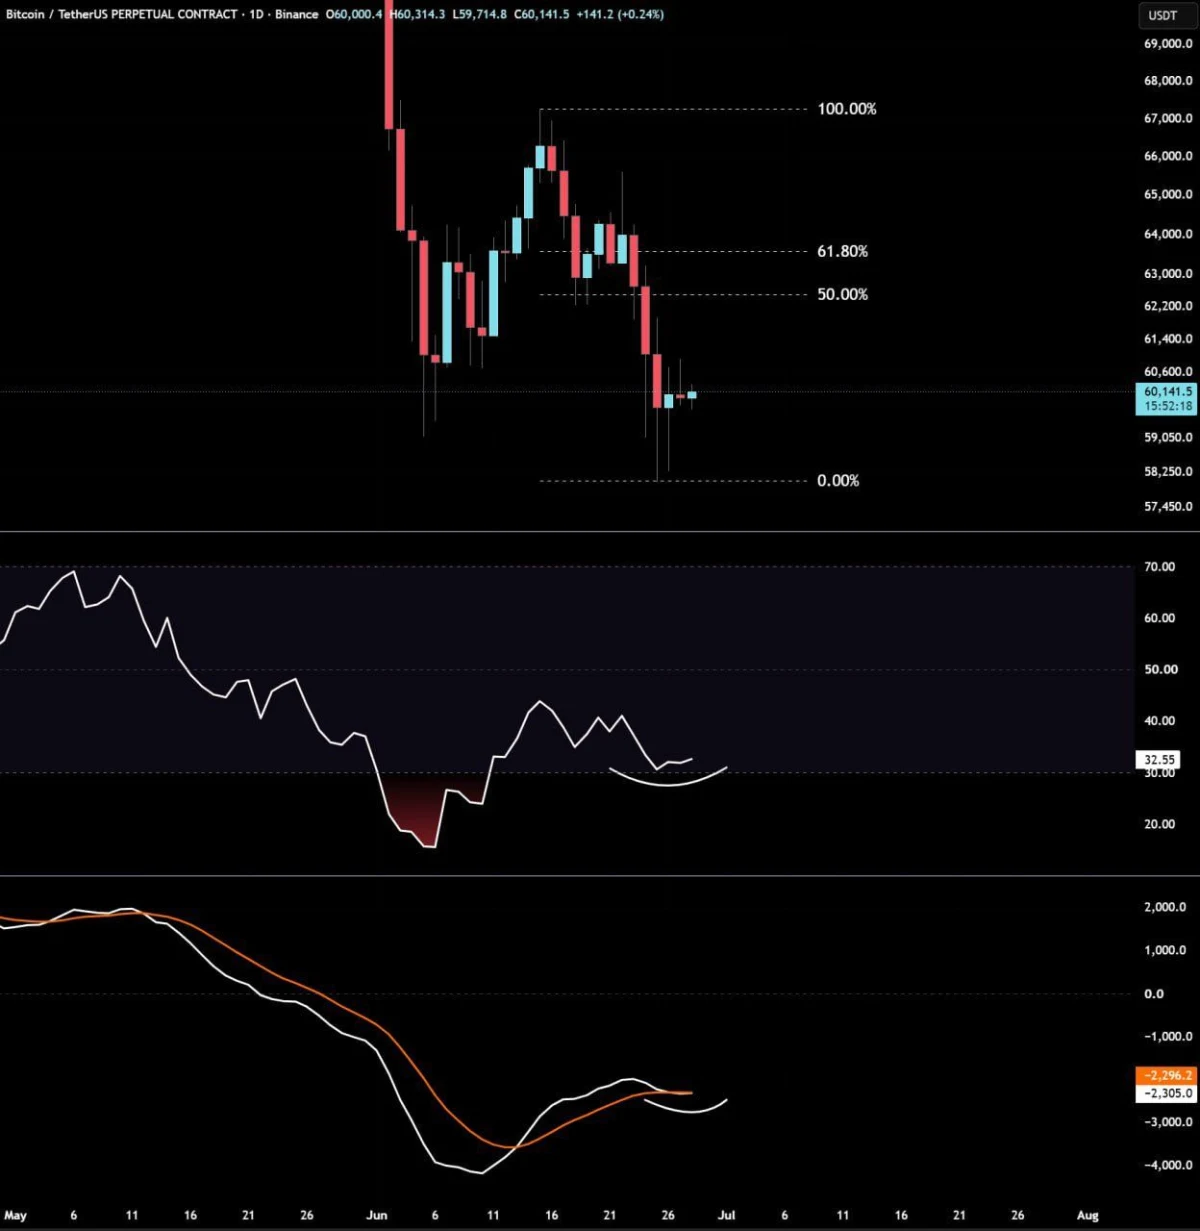
$BTC/USDT daily chart. Source: Elja on X/TradingView
Bitcoin trades near $60,100 after dropping from about $67,000 and testing support near $58,000. The current setup suggests $BTC may recover toward the $62,550 and $63,600 retracement levels if buyers hold the recent low area.
The first key level to watch is $62,550, the 50% retracement. A stronger move could bring $BTC toward $63,600, the 61.8% retracement. Both levels may act as resistance.
RSI sits near 32.5, close to oversold territory, and has started to turn higher. That supports the case for a relief bounce. MACD also remains below zero but appears to be flattening, showing that bearish momentum may be slowing.
Still, $BTC needs to reclaim the $60,600–$61,000 area before the bounce looks stronger. If $BTC loses $59,000 or breaks below the recent low near $58,000, the bullish setup weakens.
For now, this looks like a possible relief bounce, not a confirmed trend reversal.
Bitcoin Liquidity Map Shows Clusters Above $60,000
Bitcoin is trading near $60,100 as liquidation data shows several liquidity clusters above the current price.
The chart, shared by Kaz on X using Coinglass data, shows $BTC holding near the lower part of its recent range after a drop toward the $58,000 area. The largest visible liquidity zones are stacked above price, mainly around $61,800 to $62,700, $63,000 to $64,000 and higher near $65,000 to $67,000.
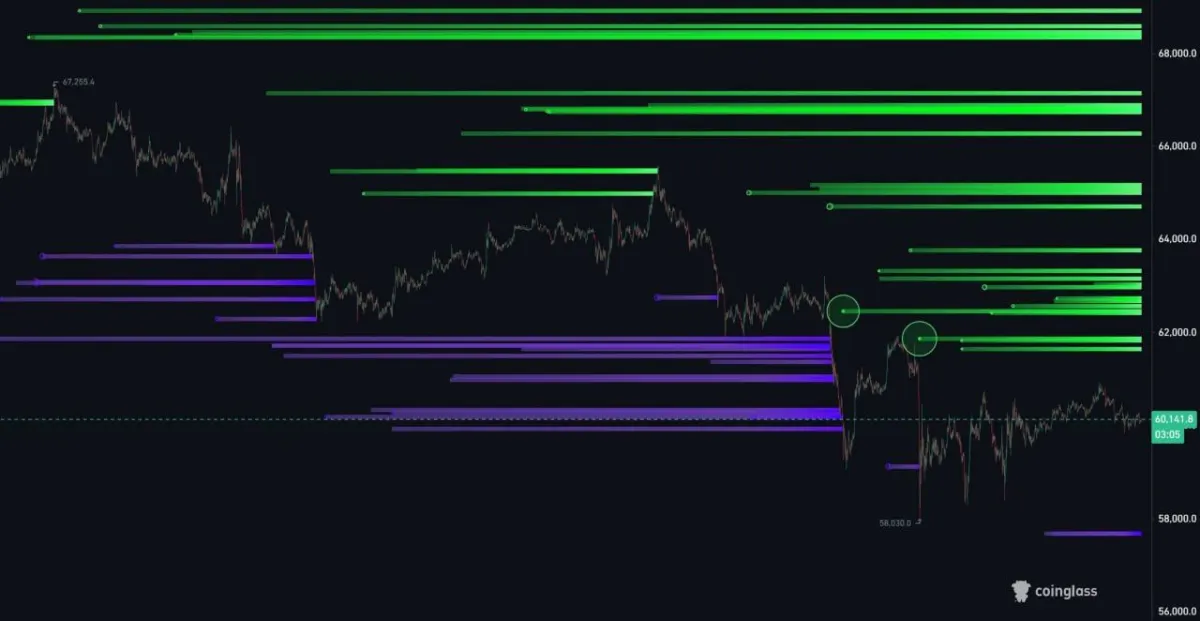
Caption: $BTC liquidation heatmap. Source: Kaz on X, Coinglass.
These levels may act as upside targets if Bitcoin starts to recover. The first area to watch is around $61,800 to $62,500. A move above that range could bring $BTC closer to $63,000 to $64,000, where more liquidity appears to be sitting.
However, the chart does not confirm an immediate breakout. Bitcoin is still trading below these liquidity zones, and buyers need to reclaim nearby resistance before the upside setup becomes stronger.
If $BTC loses the recent low near $58,000, the bullish case would weaken. For now, the liquidation map points to possible upside targets, but it does not guarantee a rally.
