

 5
5
Bitcoin trades at $61,527 on June 25, recovering from a fresh dip toward $59,000 a day earlier. Thursday’s core PCE print now decides whether that floor survives a third test.
Is $59,000 The New Support Level For Bitcoin?
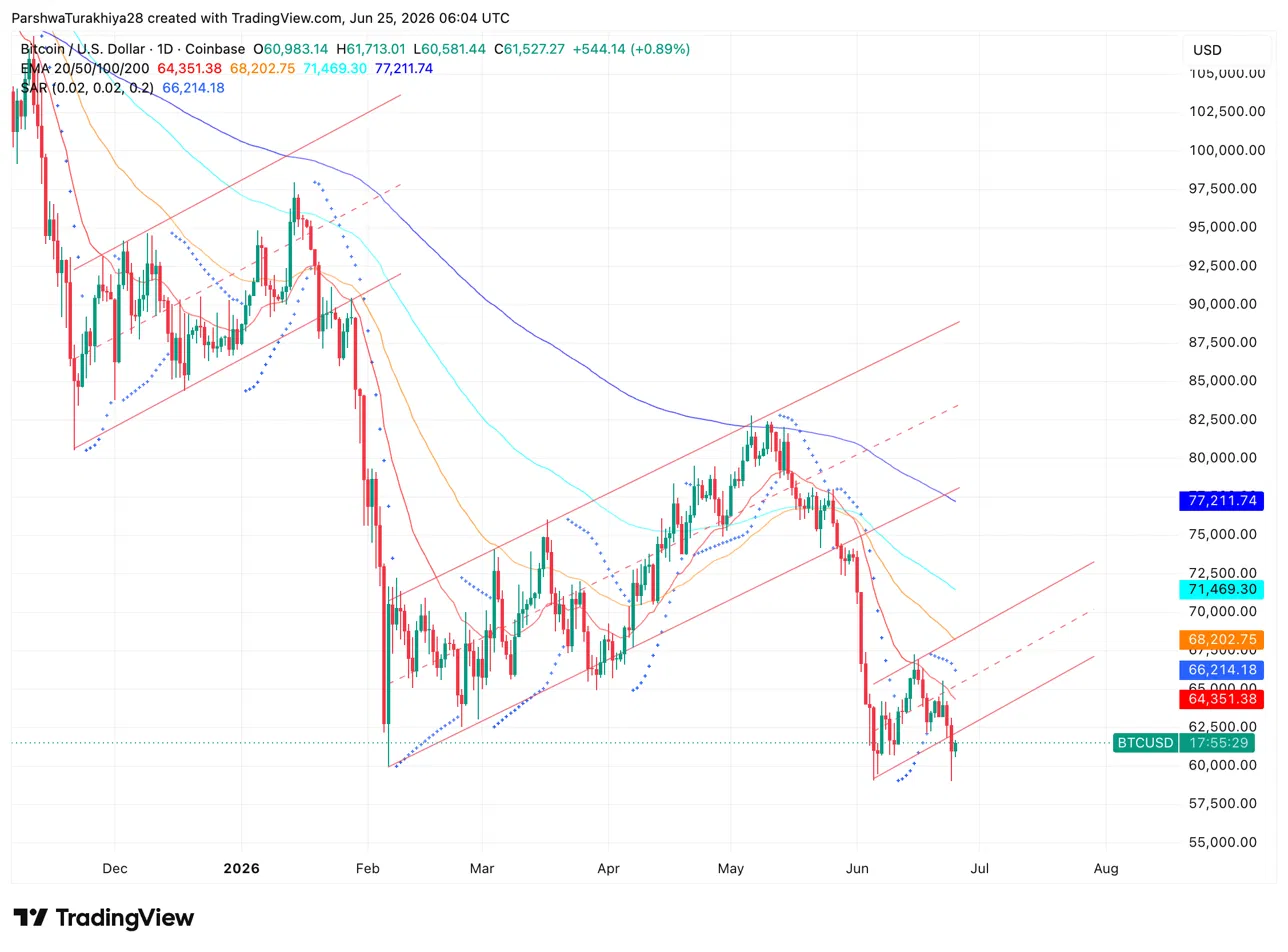
The daily chart shows $BTC trapped well below every major moving average, with the 20-day EMA at $64,351, the 50-day at $68,202, the 100-day at $71,469 and the 200-day at $77,211. That stacking is a textbook downtrend signature. Price has carved out a rough ascending channel since the early June low near $60,000, bouncing off the channel’s lower trendline twice now, on June 5 near $59,000 and again this week at $60,581.
The Parabolic SAR sits at $66,214, well above spot, confirming sellers still control the short-term trend. Key levels: support at $59,000 and $60,581, first resistance at the 20-day EMA near $64,351, then $68,202 on the 50-day, with the 200-day EMA at $77,211 marking the level bulls need to reclaim before anyone calls this a real recovery.
Why Thursday’s Inflation Data Matters For $BTC Price
CoinDesk reports that the headline PCE is forecast to have risen 4.1% year over year in May, which would be the highest reading since April 2023, while core PCE is expected near 3.3% to 3.4%, the hottest since October 2023. A print above those estimates would feed rate-hike fears and push the dollar index higher, a headwind for risk assets including crypto.
Separately, 21Shares walked back its call that Bitcoin’s four-year cycle had broken. The firm notes $BTC’s roughly 50% drawdown from its October 2025 peak near $126,000 is milder than prior cycles and hasn’t breached the $54,000 aggregate cost basis, supporting a year-end recovery to $100,000 rather than fresh highs.
What’s Driving The Bitcoin Short Squeeze Right Now?
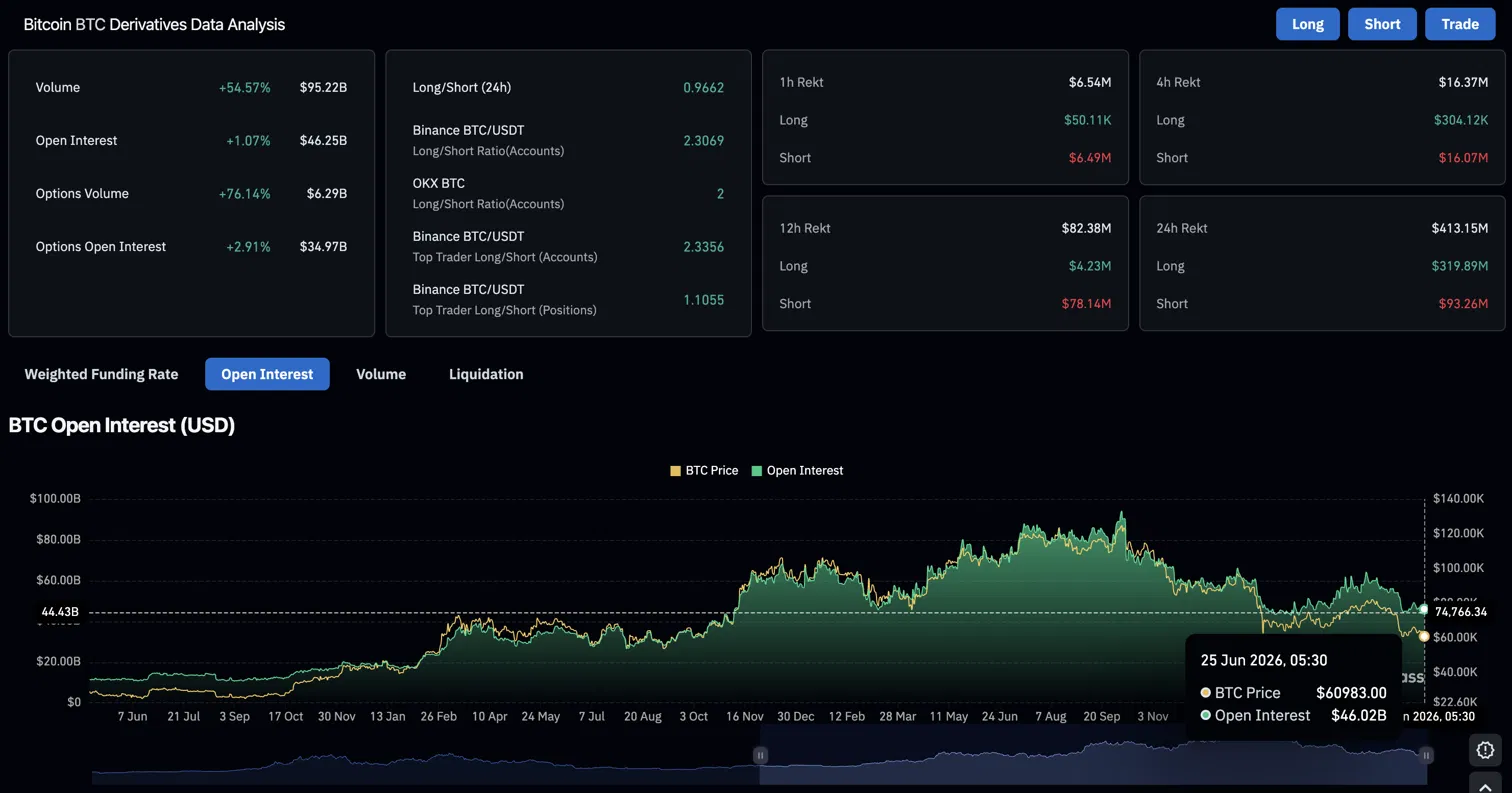
Derivatives data shows volume up 54.57% to $95.22B alongside open interest rising a modest 1.07% to $46.25B. Rising volume with flat OI usually means traders are actively repositioning rather than piling on fresh leverage.
The liquidation pattern tells the real story. Over 24 hours, longs took the brunt of the pain at $319.89M liquidated against $93.26M in shorts, a leftover from Wednesday’s drop. But in the last four hours that flipped hard: shorts lost $16.07M versus just $304K for longs, and in the past hour shorts alone ate $6.49M in liquidations. That’s a classic squeeze, bears betting against the $59,000 floor getting forced to cover as price snapped back above $61,000.
Bitcoin Price Prediction: Upside and Downside Targets
- Upside case: A cooler-than-expected core PCE eases rate fears, the dollar fades, and $BTC clears $64,351 on its way to retest $68,200.
- Downside case: A hot PCE print breaks $59,000 decisively, opening a path toward the $54,000 cost-basis line that 21Shares flags as the line between correction and capitulation.