

 7
7
Bitcoin is showing signs of recovery after reclaiming a broken downtrend, but on-chain data still points to $48,000 as a major long-term support zone. Traders are now watching whether $BTC can break above the 20-day SMA or face another pullback.
Bitcoin's CVDD Level Points to $48K as Critical Support
Bitcoin could still have one major support level left before the next phase of the bull market unfolds.
According to analyst Ali Charts, the Cumulative Value Days Destroyed (CVDD) metric, an on-chain indicator designed to identify long-term market bottoms, currently sits near $48,000. Historically, Bitcoin formed its last major cycle low when price reached this level before beginning a new bullish expansion.
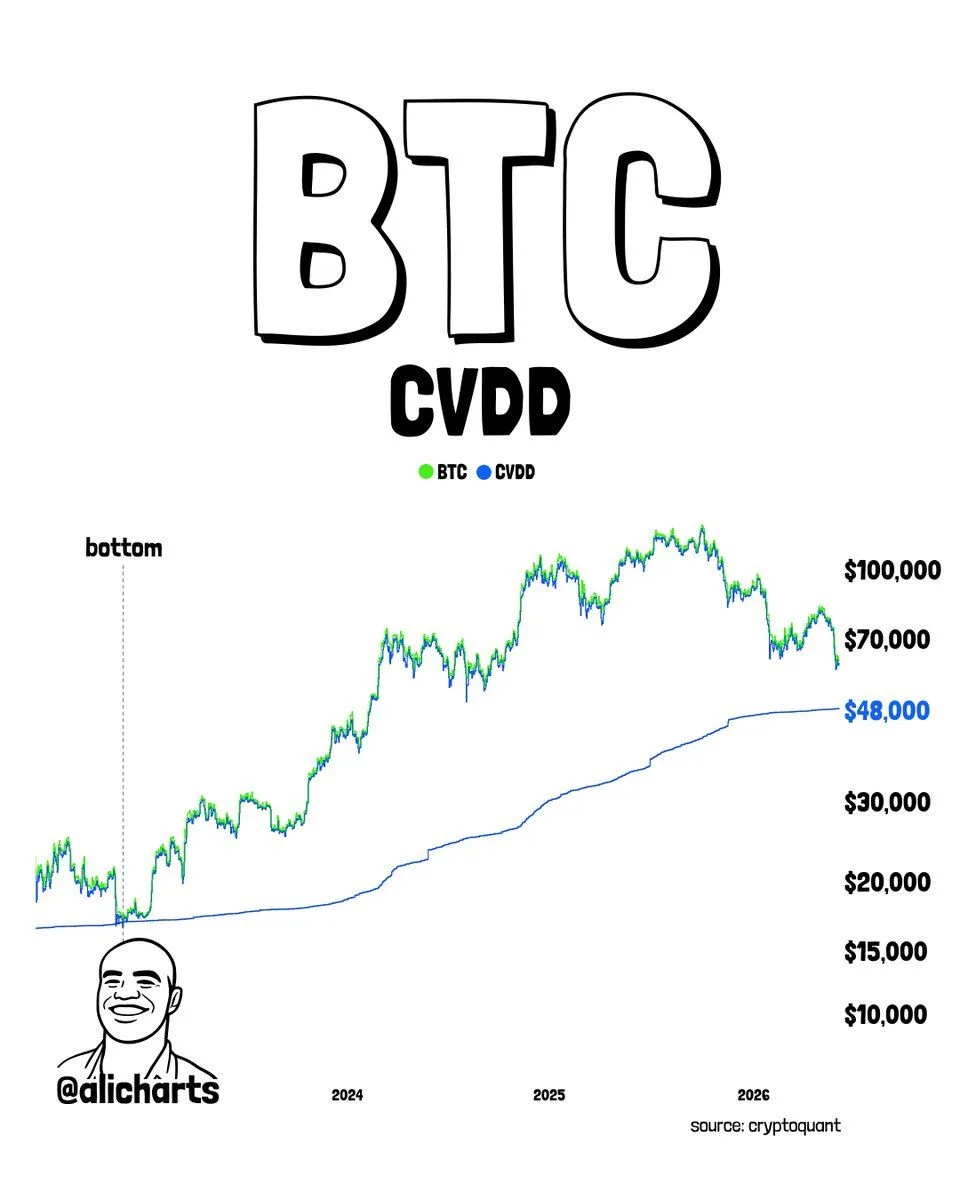
$BTC CVDD Chart. Source: Ali Charts (@alicharts), CryptoQuant
The chart compares Bitcoin's market price with the CVDD line, which measures the value of long-dormant coins being moved on-chain. The indicator has historically acted as a floor during major corrections, signaling periods when long-term holders stop distributing and accumulation begins.
According to the analysis, Bitcoin remains well above the current CVDD level near $48,000. While this does not guarantee a decline toward that price, it suggests that if the market experiences another wave of capitulation, the area could emerge as a historically significant accumulation zone.
However, CVDD is a long-term valuation tool rather than a short-term trading indicator. Bitcoin may continue its recovery without revisiting the level, and macroeconomic conditions, liquidity flows and investor sentiment will still influence price action.
For now, traders are watching whether Bitcoin can maintain its current structure above $70,000, or whether the CVDD level near $48,000 eventually comes into play as the next major support.
Bitcoin's recovery is gaining traction after buyers reclaimed a previously broken downtrend and pushed price above a key swing level.
According to SuperBitcoinBro, the $BTC daily chart closed above the last swing low while also reclaiming the descending trendline based on closing prices. The move marks a constructive shift in market structure and suggests buyers are gradually regaining control after the early June sell-off.
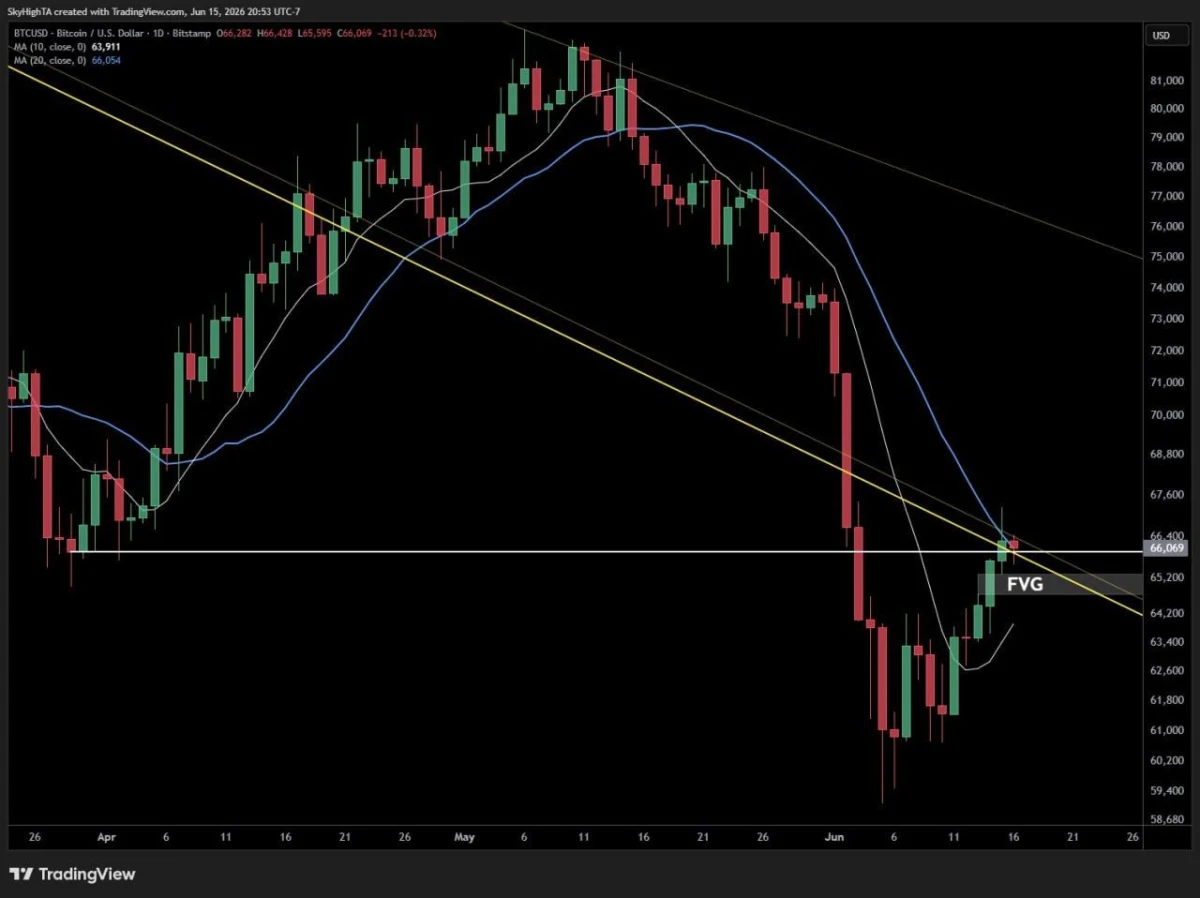
$BTC Daily Chart. Source: SuperBitcoinBro (@SuperBitcoinBro) via TradingView
The chart shows Bitcoin rebounding sharply from lows near $60,000 before reclaiming the former downtrend line. Price also managed to close above the prior swing low around $66,069, a level that had previously acted as resistance.
However, bulls encountered selling pressure near the 20-day simple moving average (SMA), leaving behind an upper wick that reflects some "sell-the-news" behavior. Despite that rejection, the analyst argued that Bitcoin's strong weekly candle reduces the likelihood of an immediate reversal.
According to the analysis, the next challenge lies in decisively breaking above the 20 SMA, which currently remains overhead resistance. If buyers succeed, Bitcoin could continue climbing the "wall of worry" into the quarterly close.
On the downside, an unfilled Fair Value Gap (FVG) and the 10-day SMA sit below current prices and may act as support if a short-term pullback occurs. Ideally, however, bulls would maintain momentum without revisiting those levels.
For now, traders are watching whether Bitcoin can overcome the 20 SMA and strengthen the bullish recovery, or whether resistance near current levels temporarily stalls the advance.

