


 3
3
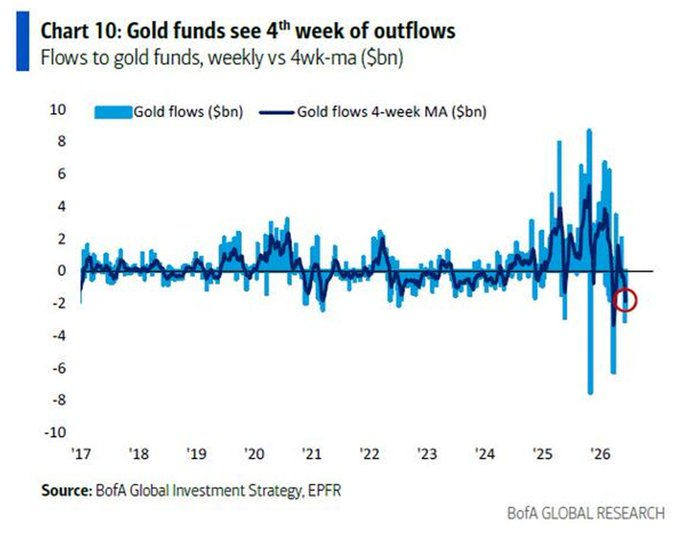
Gold (Au) is setting up for a short squeeze as gold funds posted -$2.3 billion outflows last week, marking the fourth consecutive weekly decline, with a 4-week average of -$2.0 billion. This is only below the -$3.5 billion 4-week average record seen in February. Meanwhile, Bitcoin ($BTC) is preparing a 3-Month short squeeze timeframe confluences added with the candle range theory.
Gold Outflows Hit -$2.3B, the Second-Largest on Record
According to sources, gold funds recorded -$2.3 billion in net outflows last week, marking the fourth consecutive week of withdrawals. This pushed the four-week average to approximately -$2.0 billion, the second-largest streak on record, only below the -$3.5 billion four-week average recorded in February.
Source: X
The largest U.S. gold-backed ETF, SPDR Gold Shares ($GLD), has seen approximately -$2.2 billion in outflows so far this month. Year-to-date, $GLD has recorded around -$8.1 billion in outflows, on track for the first annual withdrawal since 2023.
North America saw about -$1.1 billion in outflows in May as investors took profits after strong gains, alongside range-bound price action and rotation into technology. Asia also recorded outflows, particularly from China and India, as domestic equities strengthened. Europe then provided a counterbalance, posting inflows of approximately $334 million over the same period.
Related: Bitcoin vs Gold Debate Grows as Analyst Sees $BTC Rotation Ahead
Bitcoin Builds a 3-Month Short Squeeze Setup
Bitcoin has been trading in a volatile range through much of 2026, with Q1 highs reaching approximately $97,000–$98,000 before broader market pressures, ETF outflows, and geopolitical tensions. By early June, $BTC dipped to around $59,000–$60,000 lows before rebounding sharply toward $65,000–$67,000.
Bitcoin is constructing a compelling higher-timeframe short squeeze setup on the three-month chart. Candle Range Theory (CRT) posits that after a liquidity raid below the range low, price often delivers to the opposing high, amplified by derivatives positioning.
What’s Next for Bitcoin and Gold?
At press time, $BTC trades at $67,210.76, up 4.83% in the last 24 hours. The recent liquidity raids to $59k lows set the stage for a reversal toward Q1 highs near $97,000. With negative funding rates, massive short liquidations, and ETF flows stabilizing post U.S.-Iran peace deal, $BTC eyes a strong H2 rally.
Meanwhile, Gold faces tactical pressure in mid-2026, trading near $4,340 after pulling back from January’s record $5,589 highs amid ETF outflows. JPMorgan forecasts $6,000/oz by Q4 2026, driven by central bank buying, inflation, and safe-haven demand. This dip offers a buying opportunity in gold’s long-term bull cycle as macro risks persist.
Related: Bitcoin Price Prediction: $603M Short Squeeze Powers Push Toward $96K Resistance

