

 8
8
Bitcoin (BTC) could decline to as low as $38,500 by October 2026 if historical bear market patterns continue to repeat, according to an analysis by TradingShot.
The forecast is based on Bitcoin’s behavior during previous bear market bottoms and its relationship with long-term exponential moving averages (EMAs).
The analysis, shared in a TradingView post on June 15, suggests Bitcoin’s current bear cycle may not be complete despite the asset trading roughly 50% below its October 2025 all-time high near $126,300.
According to TradingShot, every major Bitcoin bear market bottom has historically formed within a lower EMA zone than the previous cycle.
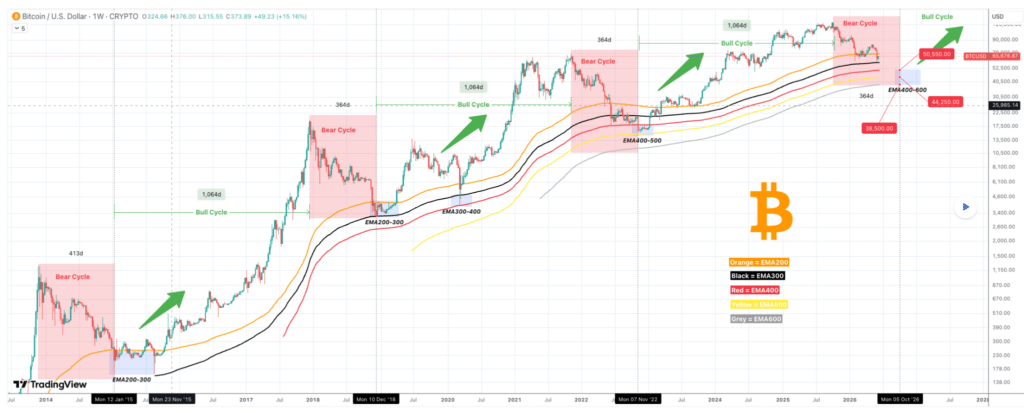
The analysis shows that Bitcoin’s January 2015 bottom occurred within the 200-week EMA to 300-week EMA range.
During the 2018 bear market, the cryptocurrency again found support in the same zone before the March 2020 COVID-19 crash pushed the asset into the EMA300-400 range.
Bitcoin’s next major bottom formed in November-December 2022 within the EMA400-500 zone. TradingShot noted that each bear market has consistently bottomed one EMA band lower than the previous cycle.
Key Bitcoin price levels
Using this pattern alongside Bitcoin’s four-year cycle theory, the analyst projects the current bear cycle could bottom around October 2026.
In the bullish case, Bitcoin would find support in the EMA400-500 range, implying a bottom between $50,550 and $44,250. In the bearish scenario, Bitcoin would fall into the EMA500-600 zone, placing the bottom between $44,250 and $38,500.
The analysis also highlights strong time symmetry, with previous bear markets lasting roughly 364 to 413 days before giving way to bull cycles that extended about 1,064 days.
Overall, Bitcoin has struggled since peaking above $126,000 in October 2025. The decline has coincided with significant spot Bitcoin ETF outflows throughout 2026, although inflows briefly returned on June 12 after weeks of selling pressure.
Bitcoin price analysis
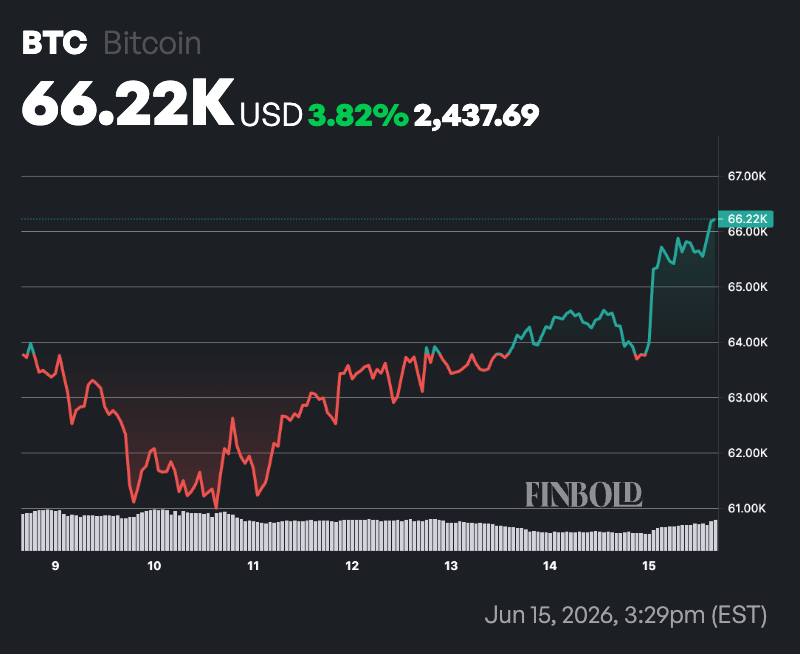
By press time, Bitcoin was trading at $66,223, up nearly 3% over the past 24 hours and 3.8% on the weekly timeframe.
From a technical perspective, Bitcoin remains under pressure, trading below both its 50-day SMA at $73,965 and 200-day SMA at $77,680. This signals that the short-term and long-term trends remain bearish, with buyers yet to reclaim key resistance levels.
Meanwhile, the 14-day RSI stands at 41.7, remaining in neutral territory but below the 50 midpoint. This indicates bearish momentum persists, although Bitcoin is not yet oversold. A move above 50 would signal improving momentum, while a decline toward 30 could point to stronger selling pressure.

