


 5
5
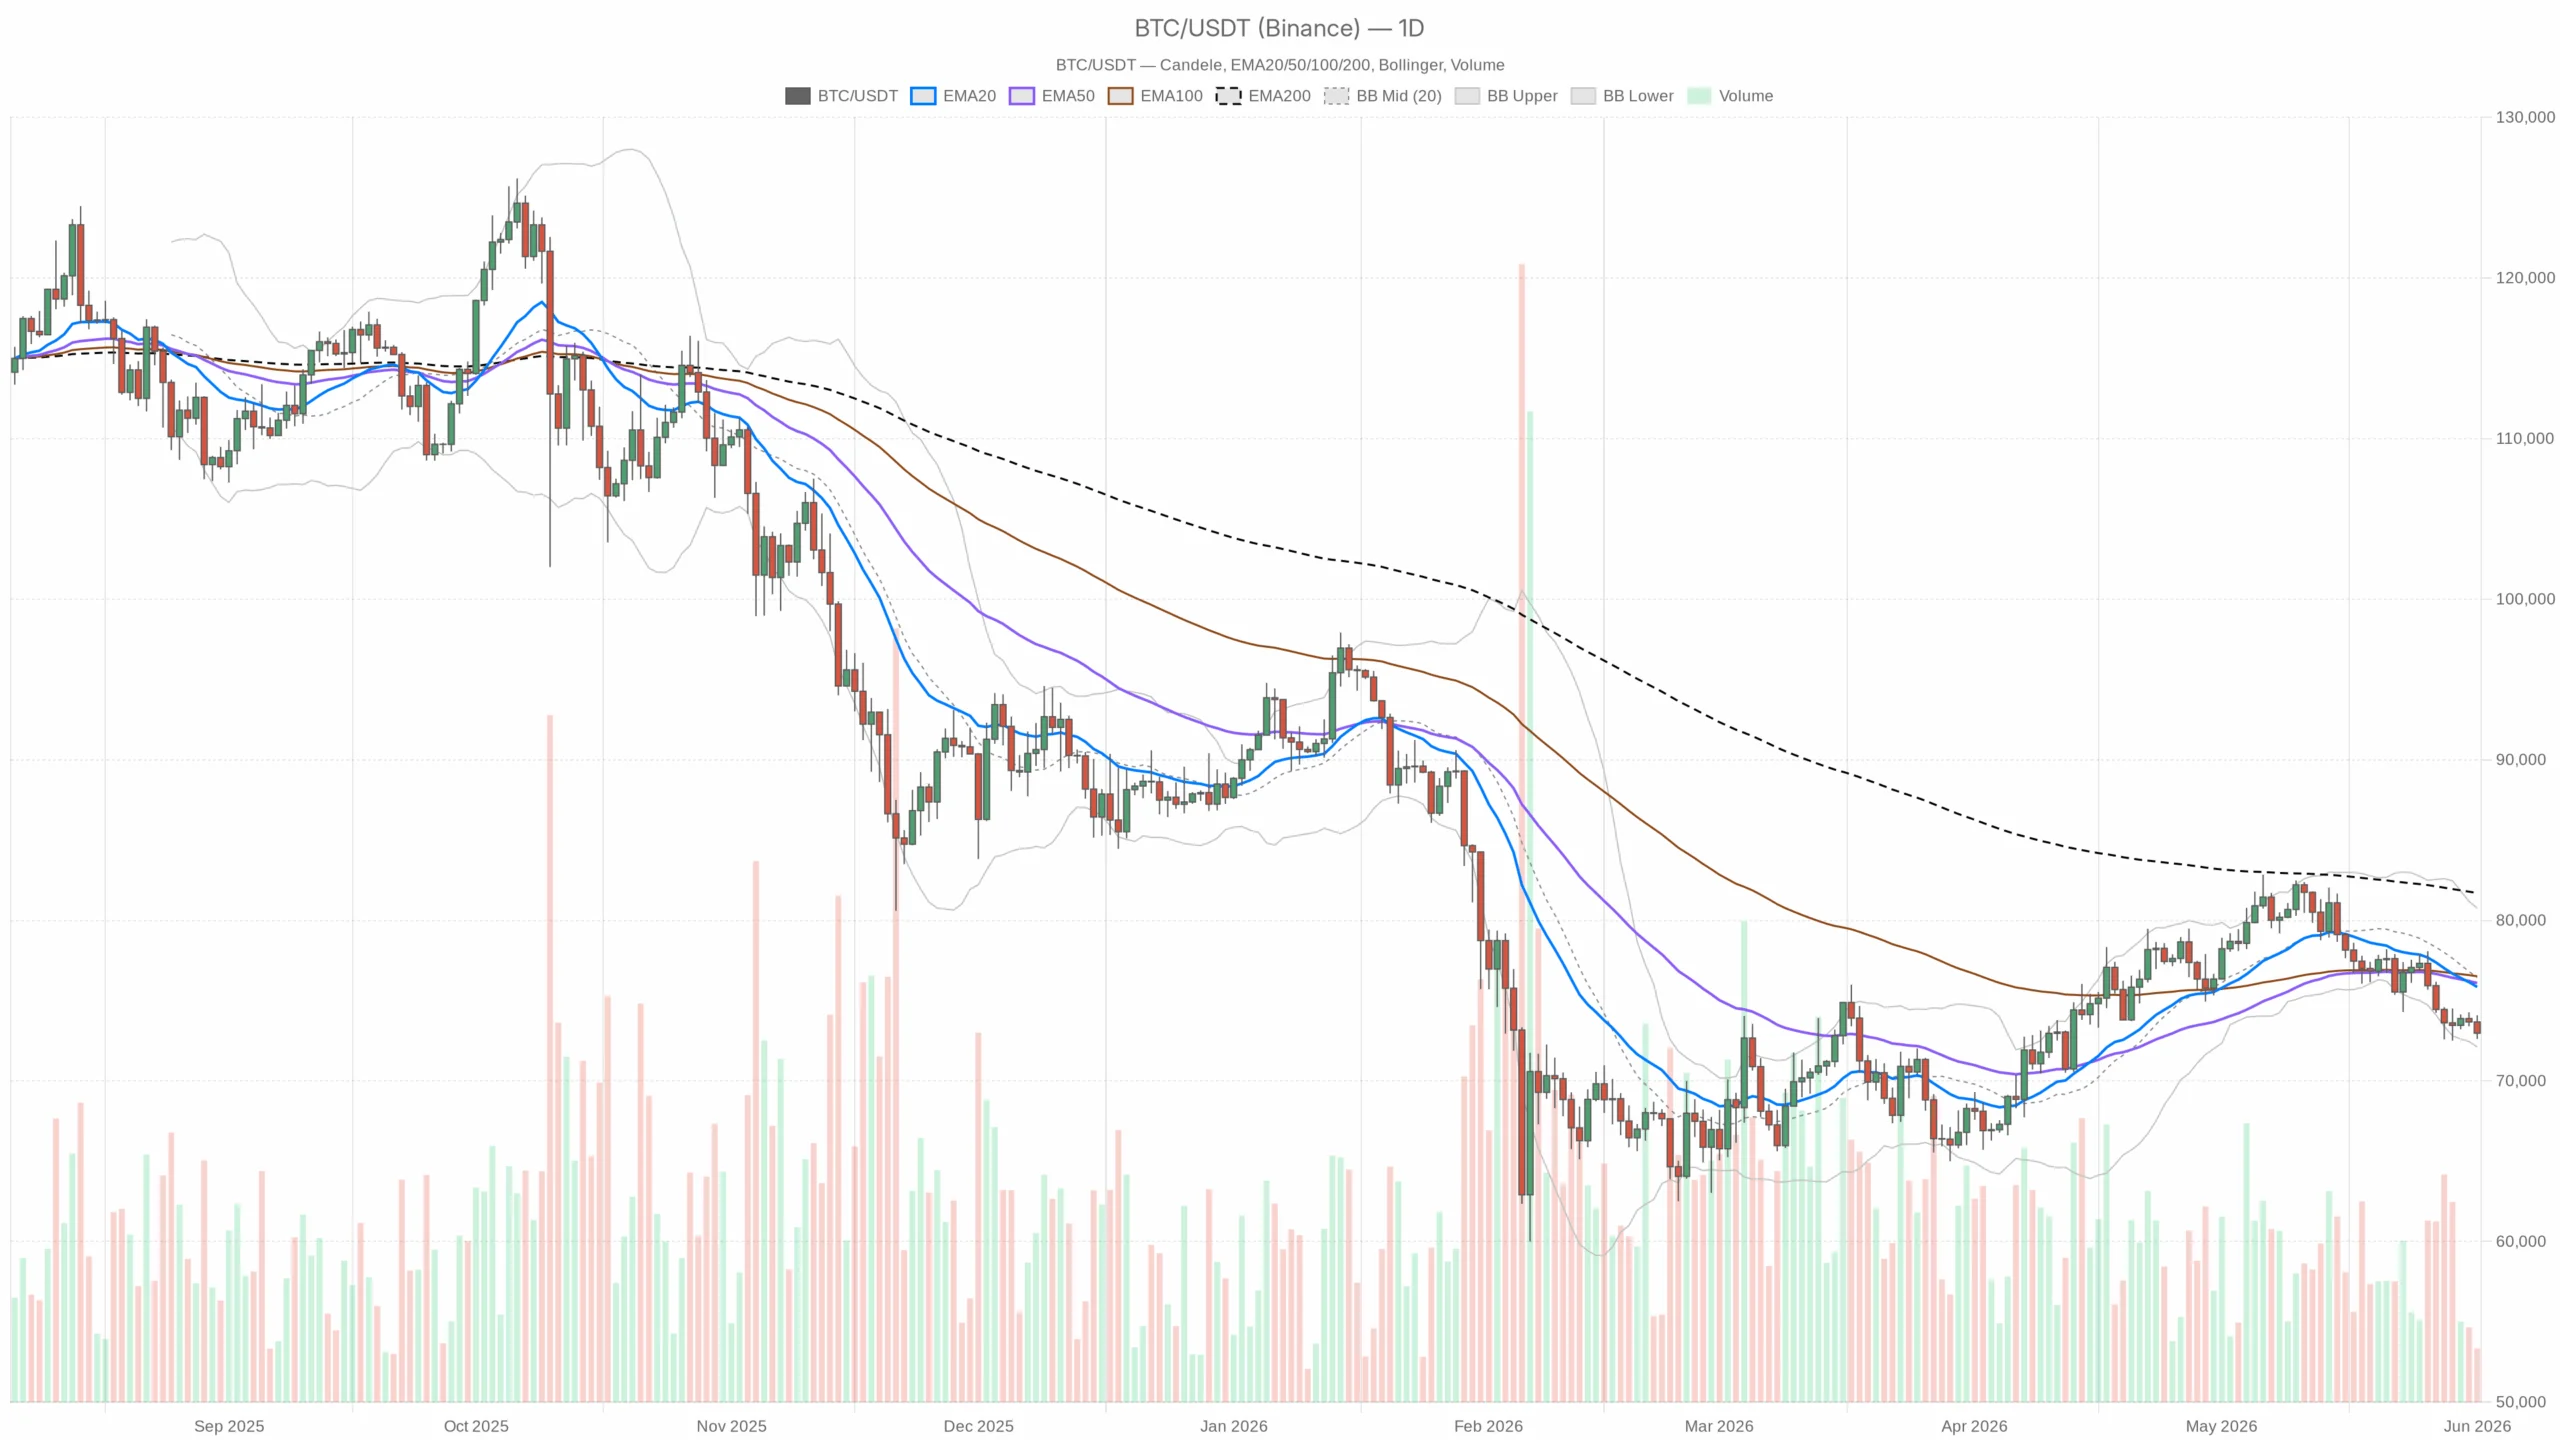
With markets cautious, the Bitcoin price today remains close to 72,972 $USDT and at the lower edge of the 72.1–73.2k range. As long as the daily stays below the moving averages, sellers are in control and bounces are more tactical than directional.
MAIN CONTEXT (D1): DOWNSIDE PRESSURE, SUPPORTS NEARBY
– D1 close: 72,972 $USDT. We are below EMA20 75,848, EMA50 76,093 and well below EMA200 81,697. This setup says that the dominant impulse is bearish and bounces have room but meet selling at the moving averages.
– RSI14 at 34.6: marked weakness but not capitulation. There is room for a further slide without excesses, but also room for a technical bounce if credible buyers appear.
– MACD in negative (line -1.198, signal -695, histogram -503): momentum still favors sellers. As long as the histogram stays below zero, the pressure has not yet eased.
– Bollinger Bands: median 76,440, lower band 72,117. The price is hovering near the lower band: typical of bearish push phases or walking the band. If no buying volume comes in, the risk is to slip; a recovery toward the median requires effort.
– ATR14 ~1,700: moderate daily range for $BTC. It implies extended but not explosive moves; breaks can be progressive, with frequent false starts.
– D1 pivots: PP 73,225, R1 73,839, S1 72,357. The price is just below the PP: the immediate battle is between the S1 72,357 cushion and the first resistance at 73,839. In practice, a narrow field where swings can reverse quickly.
INTRADAY (H1): ATTEMPT TO STABILIZE AT THE BOTTOM OF THE CHANNEL
– On H1 the price remains below EMA20 73,453, EMA50 73,658 and especially below EMA200 74,637: as long as we do not see closes back above 74.6k, every spike tends to be sold.
– RSI14 at 37.3: depressed tone, but not extreme. It can trigger relief bounces, but they are unlikely to be self-sustaining without breaking resistances.
– MACD negative (histogram -86): momentum still heavy, with signs of flattening but no valid reversal.
– H1 Bollinger: median 73,518, lower band 72,865. The price is touching the lower band: likely oscillation between 72.9k and 73.5k until a catalyst arrives.
– ATR H1 ~399: high intraday noise. Micro-levels are tested often: expect fakeouts around the pivots.
– H1 pivots: PP 72,964, R1 73,026, S1 72,910. We are on the PP: micro-equilibrium; above 73.03k first breath, loss of 72.91k reopens the lows.
TRADING (15M): SHY BASE-BUILDING, SELLERS STILL OVERHEAD
– On 15m the price is just below EMA20 73,096, and below EMA50 73,363 and EMA200 73,655: micro-attempt at a base, but the moving-average cap looms between 73.1–73.7k.
– RSI14 at 40.2: sellers are losing a bit of steam, but buyers do not have the wheel yet.
– MACD with slightly positive histogram (+2.34): first sign of easing pressure, more indicative of a pause than a reversal.
– 15m Bollinger: median 73,118, lower band 72,601. Reactions from the 72.6–72.9k area make sense, but to have follow-through it is necessary to break above the medians and hold.
– ATR 15m ~171: scalping-type volatility, with spikes that can invalidate stops that are too tight.
– 15m pivots: PP 72,969, R1 72,992, S1 72,949. Price anchored to the PP: intraday magnet that favors compressed bounces.
PLAUSIBLE BULLISH SCENARIO
- Setup: defense of the 72,357 (S1 D1)–72,117 (D1 lower band) area with recovery above 73,839 (R1 D1).
- Trigger: H1 closes above 74,637 (EMA200 H1). This would open room toward 76,440 (D1 Bollinger median).
- Invalidation: return below 72,357 on H1 or, worse, D1 close below 72,117. In that case the bounce was only relief.
PLAUSIBLE BEARISH SCENARIO
- Setup: rejected between 73.5–73.8k, with lower highs on H1.
- Trigger: loss of 72,357 (S1 D1) and pressure below 72,117 (D1 lower band). With D1 ATR ~1,700, there is statistical room to extend into the low 70k area if flows remain unfavorable.
- Invalidation: structural recovery above 74,637 (EMA200 H1) and then above 75,848 (EMA20 D1), which would dismantle the short-term bearish inertia.
HOW TO READ THE CONTEXT NOW
The Bitcoin price today reflects a risk-off climate. The Fear & Greed index at 29 and flows into US ETFs remain lukewarm: a headwind for recovery attempts. With the $BTC real-time price stuck below the daily moving averages, it makes sense to respect the trend until it is invalidated.
For those looking at the Bitcoin price in euros or asking how much a bitcoin is worth today, the technical dynamics do not change. In operational summary: patience on breakouts, discipline on stops and care not to chase moves born on timeframes that are too short. That said, as long as we do not see a reclaim above 74.6k and 75.8k, the market remains in the hands of sellers, with bounces better exploited than chased. The Bitcoin value today is driven by the D1; near intraday pivots (72.95–73.03k area) fakeouts are the norm.