


 6
6
Crypto analyst Blade has pointed to a Bitcoin trend that could signal when the leading crypto could find a bottom in this bear market cycle. The analyst also suggested that $BTC could rally to as high as $400,000 in the next bull market.
Bitcoin Trend Which Points To When $BTC Could Bottom
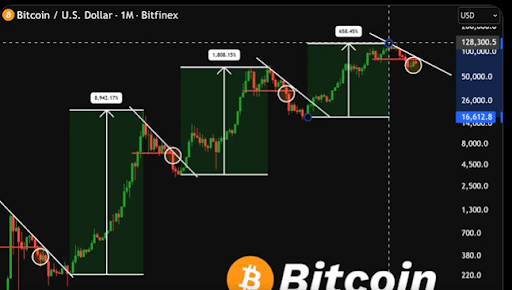
In an X post, Blade noted that every $BTC cycle has ended the same way, with the trendline on the monthly chart breaking and support getting lost. He noted that when this happens, market participants call for a deeper crash, but that is when Bitcoin finds a bottom, just as it has for 15 years.
The analyst also mentioned that when Bitcoin finds a bottom, it builds a base and then starts the next leg higher. He remarked that 2026 is starting to look familiar, signaling that a bullish reversal was on the horizon. His accompanying chart showed that $BTC could rally to a new high of around $400,000 in this next bull run. The chart also signaled that this target could be reached by 2030.
In another X post, Blade said that Bitcoin is getting ready for the final leg. This came as he noted that $BTC has been making lower highs for almost a year and, as a result, most people assume the bull run is over. However, he pointed out that the leading crypto remains within the same structure, citing a Megaphone Bottom pattern. The analyst added that point 4 may already be in and that point 5 is now the only target.
His accompanying chart showed that point 4 is the bottom, with the possibility that Bitcoin may have bottomed at the February low of $60,000. With this, the leading crypto may now be targeting a rally to point 5 at around $160,000, which would mark a new all-time high for $BTC.
A Drop To The Mid $60,000 Range Could Still Be On The Cards
In an X post, crypto analyst Colin signaled that Bitcoin could drop to the mid $60,000 range. He pointed to a Head-and-Shoulders (H&S) top pattern, which he noted is currently retesting the neckline where it broke down from. The analyst added that a rejection from that level would be a strong confirmation of the top pattern.
Colin declared that Bitcoin is being forced to make a decision and that it should happen within a day or two. He noted that the target is the mid-$60,000 range because a breakdown would simultaneously be a breakdown of the H&S and the channel. Meanwhile, the analyst also pointed to a bear flag that had formed for $BTC.
At the time of writing, the Bitcoin price is trading at around $73,400, down in the last 24 hours, according to data from CoinMarketCap.