


 5
5
Bitcoin [$BTC] has endured a tough second half of May. Earlier this month, the leading crypto marched, seemingly inexorably, past the $80k summit. The bullish price action was at odds with the myriad of on-chain metrics that suggested buyer strength was waning.
The short-term upward momentum was also part of a relief rally that the coin was seeing after the sizeable downward spiral earlier in the year.
Bitcoin’s continued gains despite the backdrop of a difficult macro environment, but the $83k-$89k was expected to present a significant hurdle to the rally.
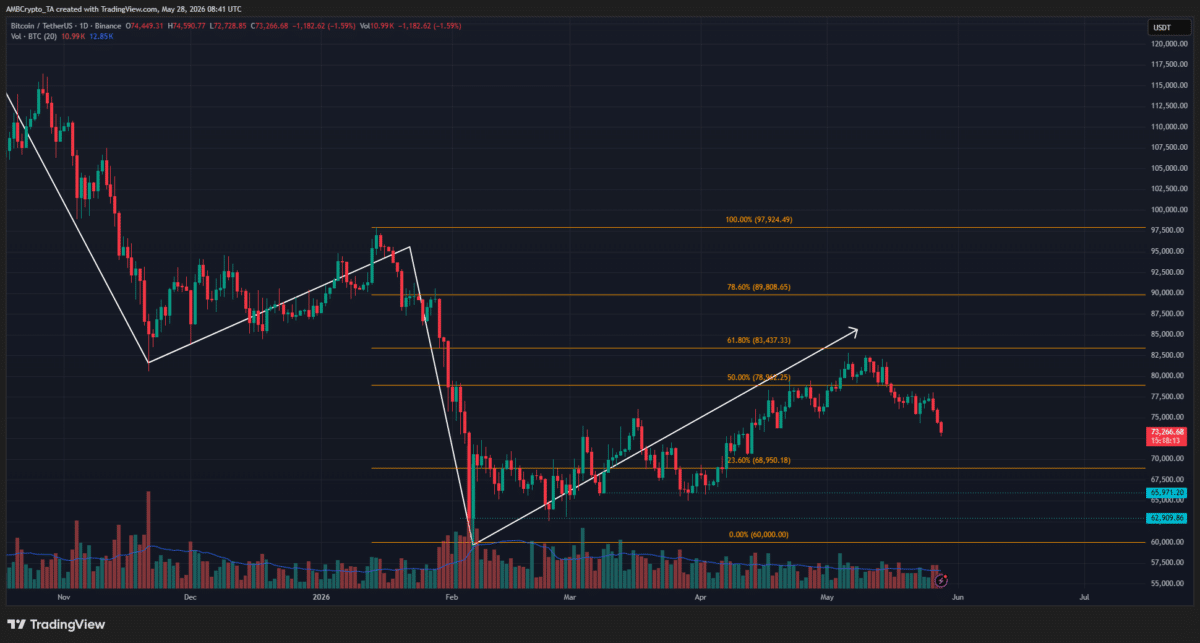
The bearish swing structure set in place earlier this year almost produced a relief rally into the Fibonacci golden pocket at $83.4k-$89.8k. Buyers showed exhaustion above $80K, and the supply overhang left bulls facing a steep uphill battle. They failed to hold momentum, allowing bears to extend the broader downtrend.
This brings gloomy southward price targets of $51,049 and $36,562 as the Fibonacci extension price targets in the coming months.
Another bearish structural shift for Bitcoin
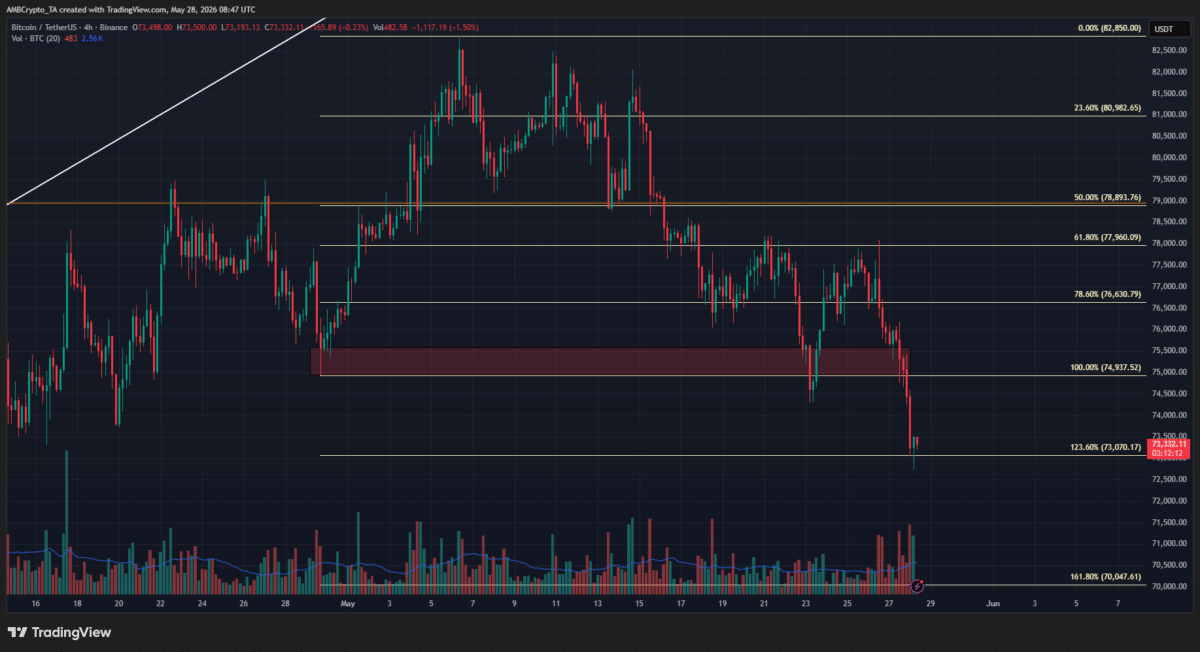
The $75k area, highlighted in red, was the latest higher low in Bitcoin’s former uptrend that reached $82.8k. This swing low was breached on the 23rd of May.
Effectively, it shifted the swing structure bearishly. The structure across the daily and 4-hour charts has aligned now, giving traders reason to stay bearish.
The price has stalled at the $73k round number, which was also the 23.6% southward extension. It is possible that the bearish move would be sustained.
Should $BTC traders sell?
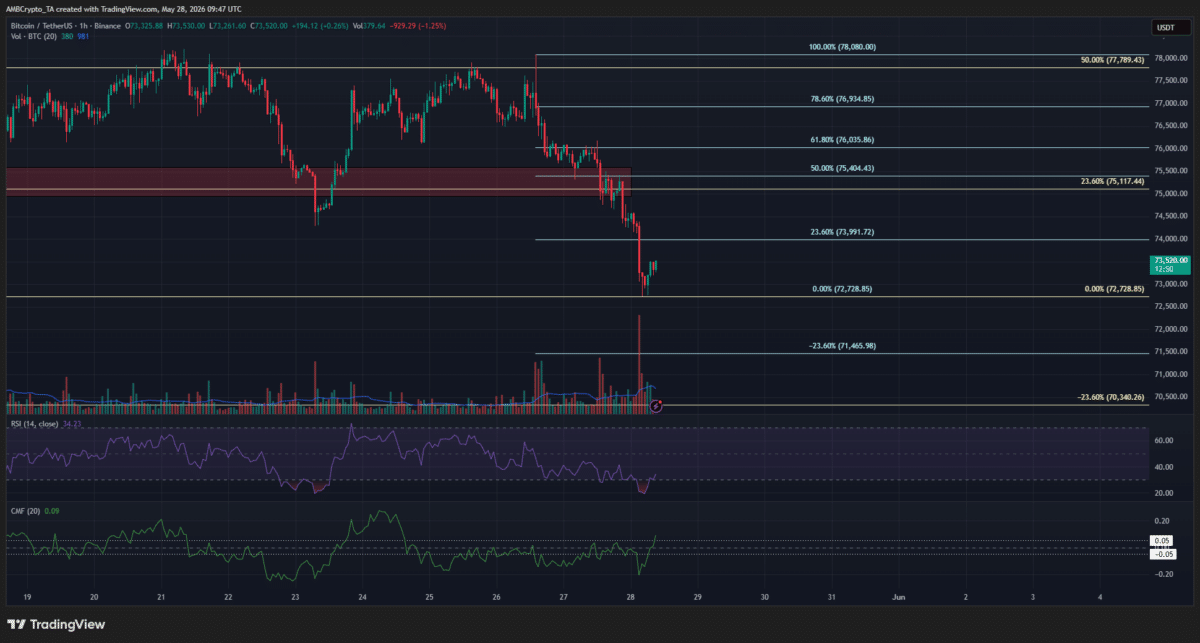
There is potential for a Bitcoin bounce to $75k in the following days. The hourly RSI was recovering from oversold territory. Instead of trying to take the risky route of going long on this possible bounce, traders need to wait for a retest of key resistance levels to sell.
That means the $75.4k, $76k, and $76.9k levels could be tested before a bearish continuation. This continuation would lead $BTC toward $70k and likely below it, too.
If this lower high at $78,080 is breached, a bounce to the $80.6k level would become more likely. Even in that scenario, the bias would remain bearish.
Final Summary
- The 1-day and 4-hour price charts’ swing structures aligned bearishly.
- This meant that the relief rally of the past two months had finally come to an end, and the sellers were back in control.

 coinpedia.org
 en.bitcoinsistemi.com
 u.today

 cryptoticker.io