

 9
9
The market is still trying to figure out what the recent pullback really means.
On the technical front, Bitcoin’s 5.8% correction last week from its $82k level triggered a frenzy over whether this marked a local top for the asset. Looking at the macro setup, the market split makes sense, keeping $BTC’s current structure a textbook setup for speculative traders to profit from its volatility.
Recent data shows bears have been the most profitable in the move.
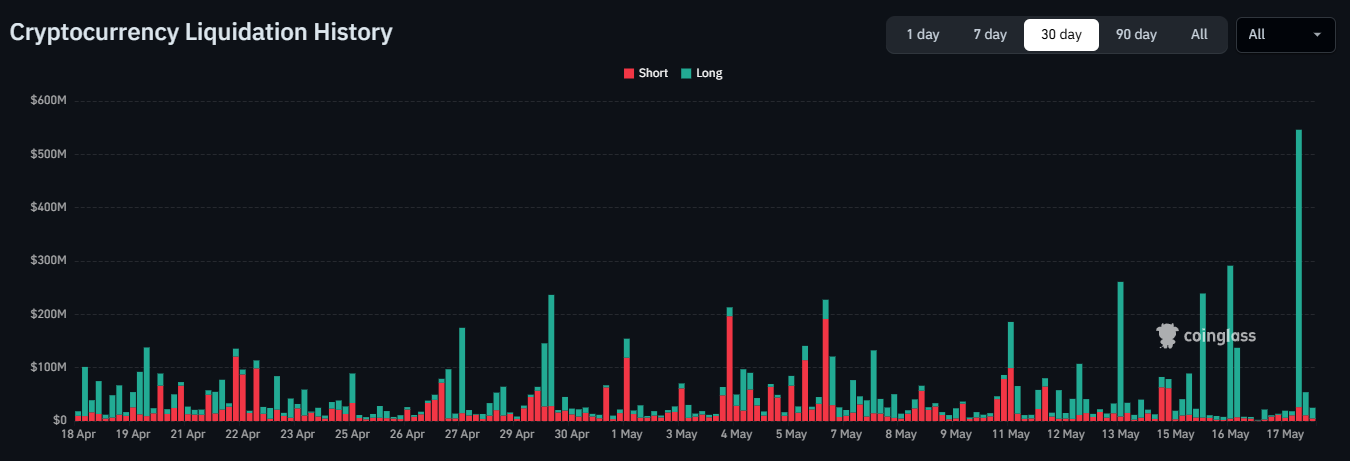
According to CoinGlass, $630 million in positions were liquidated on the 17th of May as $BTC broke below $77k, marking the first major cascade in about a month. However, unlike the April move, this time 90% of the liquidations came from longs.
Naturally, the market is starting to feel the pressure.
CryptoQuant data shows the Coinbase Premium Index still trending in negative territory, pointing to weak conviction from U.S. buyers.
At the same time, $BTC ETFs have flipped negative, with outflows taking the lead and reinforcing a broader risk-off tone among institutional investors. In this context, the pullback starts to look more like the early stages of a deeper correction, with some positioning already eyeing the $60k zone.
The question now is whether the holder’s patience is starting to wear thin.
Long liquidations hit, but Bitcoin LTHs stay steady
To separate a short-term pullback from a healthy reset, the key is tracking capitulation signals.
Despite the recent correction, Bitcoin [$BTC] isn’t showing clear signs of exit liquidity. Instead, on-chain data shows long-term holders (LTHs) at their highest levels since 2025.
According to CryptoQuant, LTH supply has risen to 15.26 million $BTC, the highest since August 2025. In fact, over the past 30 days, LTHs have accumulated 316k $BTC, reversing the 650k $BTC that left long-term wallets during the late-year selloff.
Zooming out, when this is combined with Binance Research’s latest report, the setup becomes clearer. The chart shows SLRV sitting deep in its historical bottom zone, signaling market apathy. This suggests a market where long-term holders dominate supply while short-term participants remain largely sidelined.
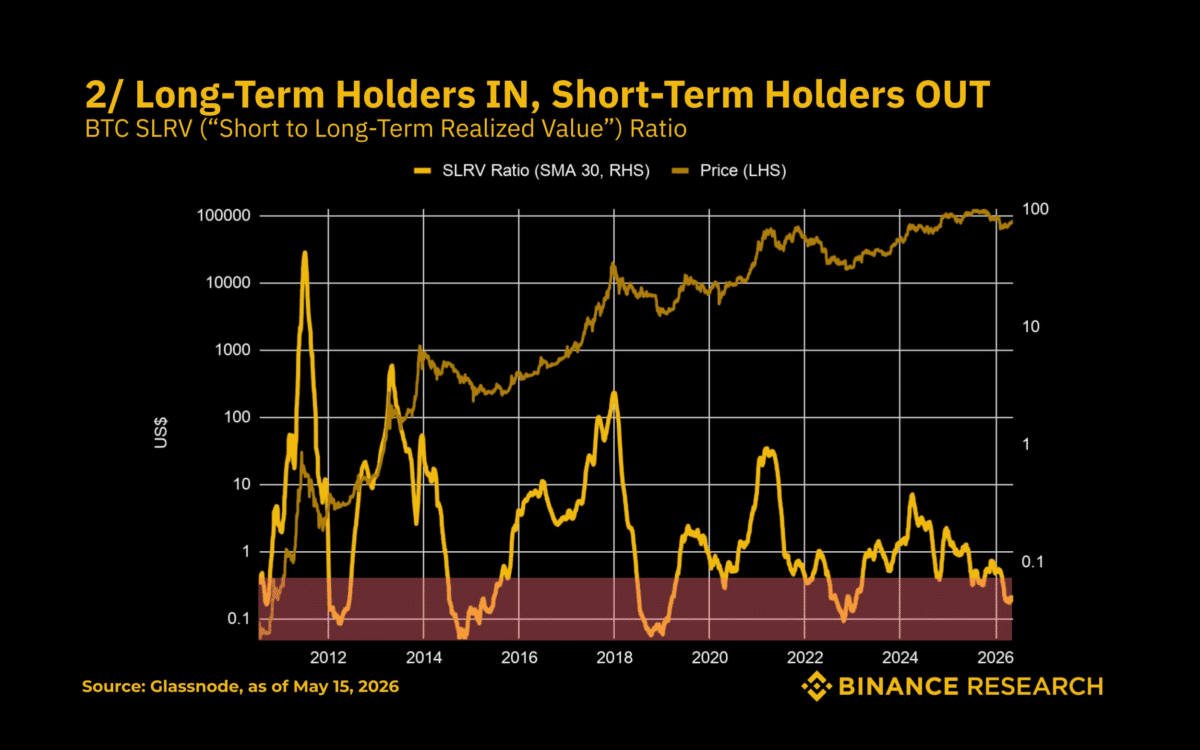
Notably, the report also highlights that nearly 60% of the Bitcoin supply hasn’t moved in over a year.
In essence, despite Bitcoin still trading more than 30% below its $126k peak, supply continues to tighten. In the current context, this kind of positioning reinforces a risk-on structure underneath price action, marking a clear divergence from earlier capitulation phases.
Against this backdrop, the recent pullback looks more like a textbook deleveraging phase than a structural breakdown. In that sense, the probability of a move toward $60k remains limited in the near term.
Final Summary
- Long-term holders keep accumulating, even as the recent pullback triggers heavy liquidations.
- On-chain strength contrasts with short-term pressure from ETFs and derivatives flows.

