

 1
1
Bitcoin is losing momentum after rejection near the $82,000 area, with traders now watching whether $BTC can hold the $74,917 support level. A deeper pullback could bring the $71,000 to $72,000 zone back into focus as Bitcoin continues to trade inside its rising daily channel.
Bitcoin Price Tests 61.8% Fib as $BTC Must Hold $74,917 Support
Bitcoin has pulled back toward the 61.8% Fibonacci retracement level near $77,851, putting the $74,917 support level in focus for the next $BTC price move.
The 4-hour chart shared by Man of Bitcoin on X shows $BTC trading near $77,989 after failing to hold the higher range near $82,750. The analyst said Bitcoin has reached the 61.8% Fib retracement in wave y of wave (2).
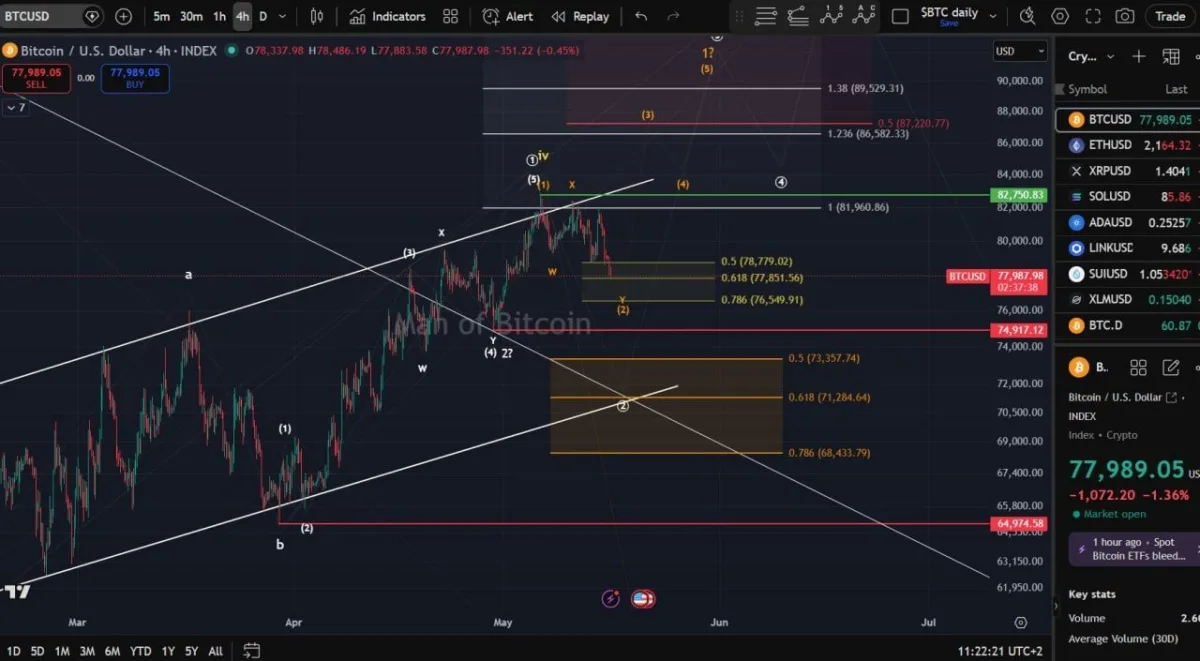
Bitcoin 4-Hour Price Chart. Source: Man of Bitcoin on X
The chart shows short-term Fibonacci levels at $78,779, $77,851, and $76,549. Bitcoin is now trading close to the 61.8% level, which often acts as a key area during corrective moves.
$BTC needs to stay above $74,917 to keep the orange roadmap active, according to the chart. That level sits below the current retracement zone and marks the main invalidation area for the near-term structure.
If Bitcoin holds above $74,917, the setup could still allow another move higher. The chart shows resistance near $81,960 and $82,750, where $BTC previously struggled.
A stronger rebound could bring the $86,582 and $87,220 area into focus. The higher extension level near $89,529 also appears on the chart as a possible upside target if momentum returns.
However, a break below $74,917 would weaken the orange roadmap. In that case, $BTC could move into the deeper support zone between $73,357 and $68,433.
For now, Bitcoin remains in a corrective phase. The key range is clear: support sits at $74,917, while resistance stands near $81,960 to $82,750.
Bitcoin Price Could Retest $71K Support as $BTC Pulls Back From Channel Top
Bitcoin is pulling back from the upper boundary of its rising daily channel, putting the $71,000 to $72,000 support zone back in focus.
The daily BTCUSDT chart shared by Captain Faibik on X shows Bitcoin trading near $78,823 after failing to extend above the channel top. The chart shows $BTC moving inside an upward-sloping channel since its February low.
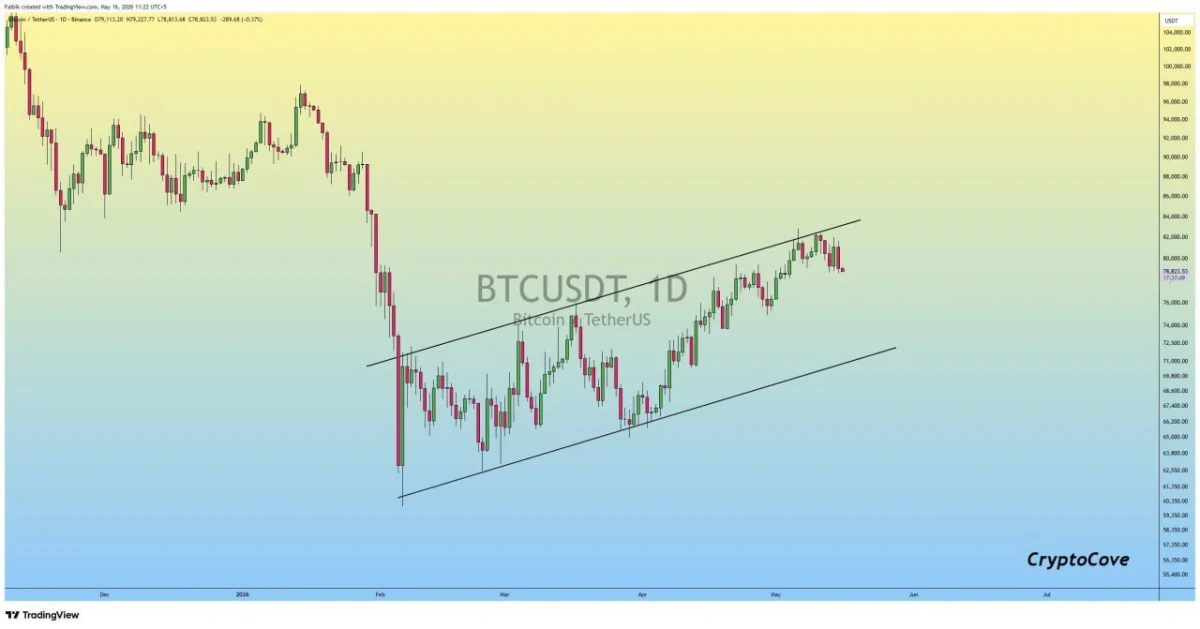
Bitcoin Daily Price Channel Chart. Source: Captain Faibik on X
$BTC recently reached the upper trendline near the $82,000 area, where the rally lost momentum. The latest candles show a pullback from that zone, suggesting Bitcoin may revisit lower support before attempting another move higher.
Captain Faibik said $BTC may retest the $71,000 to $72,000 support zone again. That area sits near the lower half of the rising channel and lines up with a previous reaction zone on the chart.
If Bitcoin reaches that range, buyers would need to defend it to keep the rising channel structure active. A strong bounce from $71,000 to $72,000 could keep $BTC inside the broader recovery path.
However, a break below the channel’s lower boundary would weaken the setup. In that case, $BTC could lose the structure that has supported the recovery since February.
For now, Bitcoin remains inside the rising daily channel. The main resistance sits near the upper trendline around $82,000, while the key support zone stands near $71,000 to $72,000.

