

 7
7
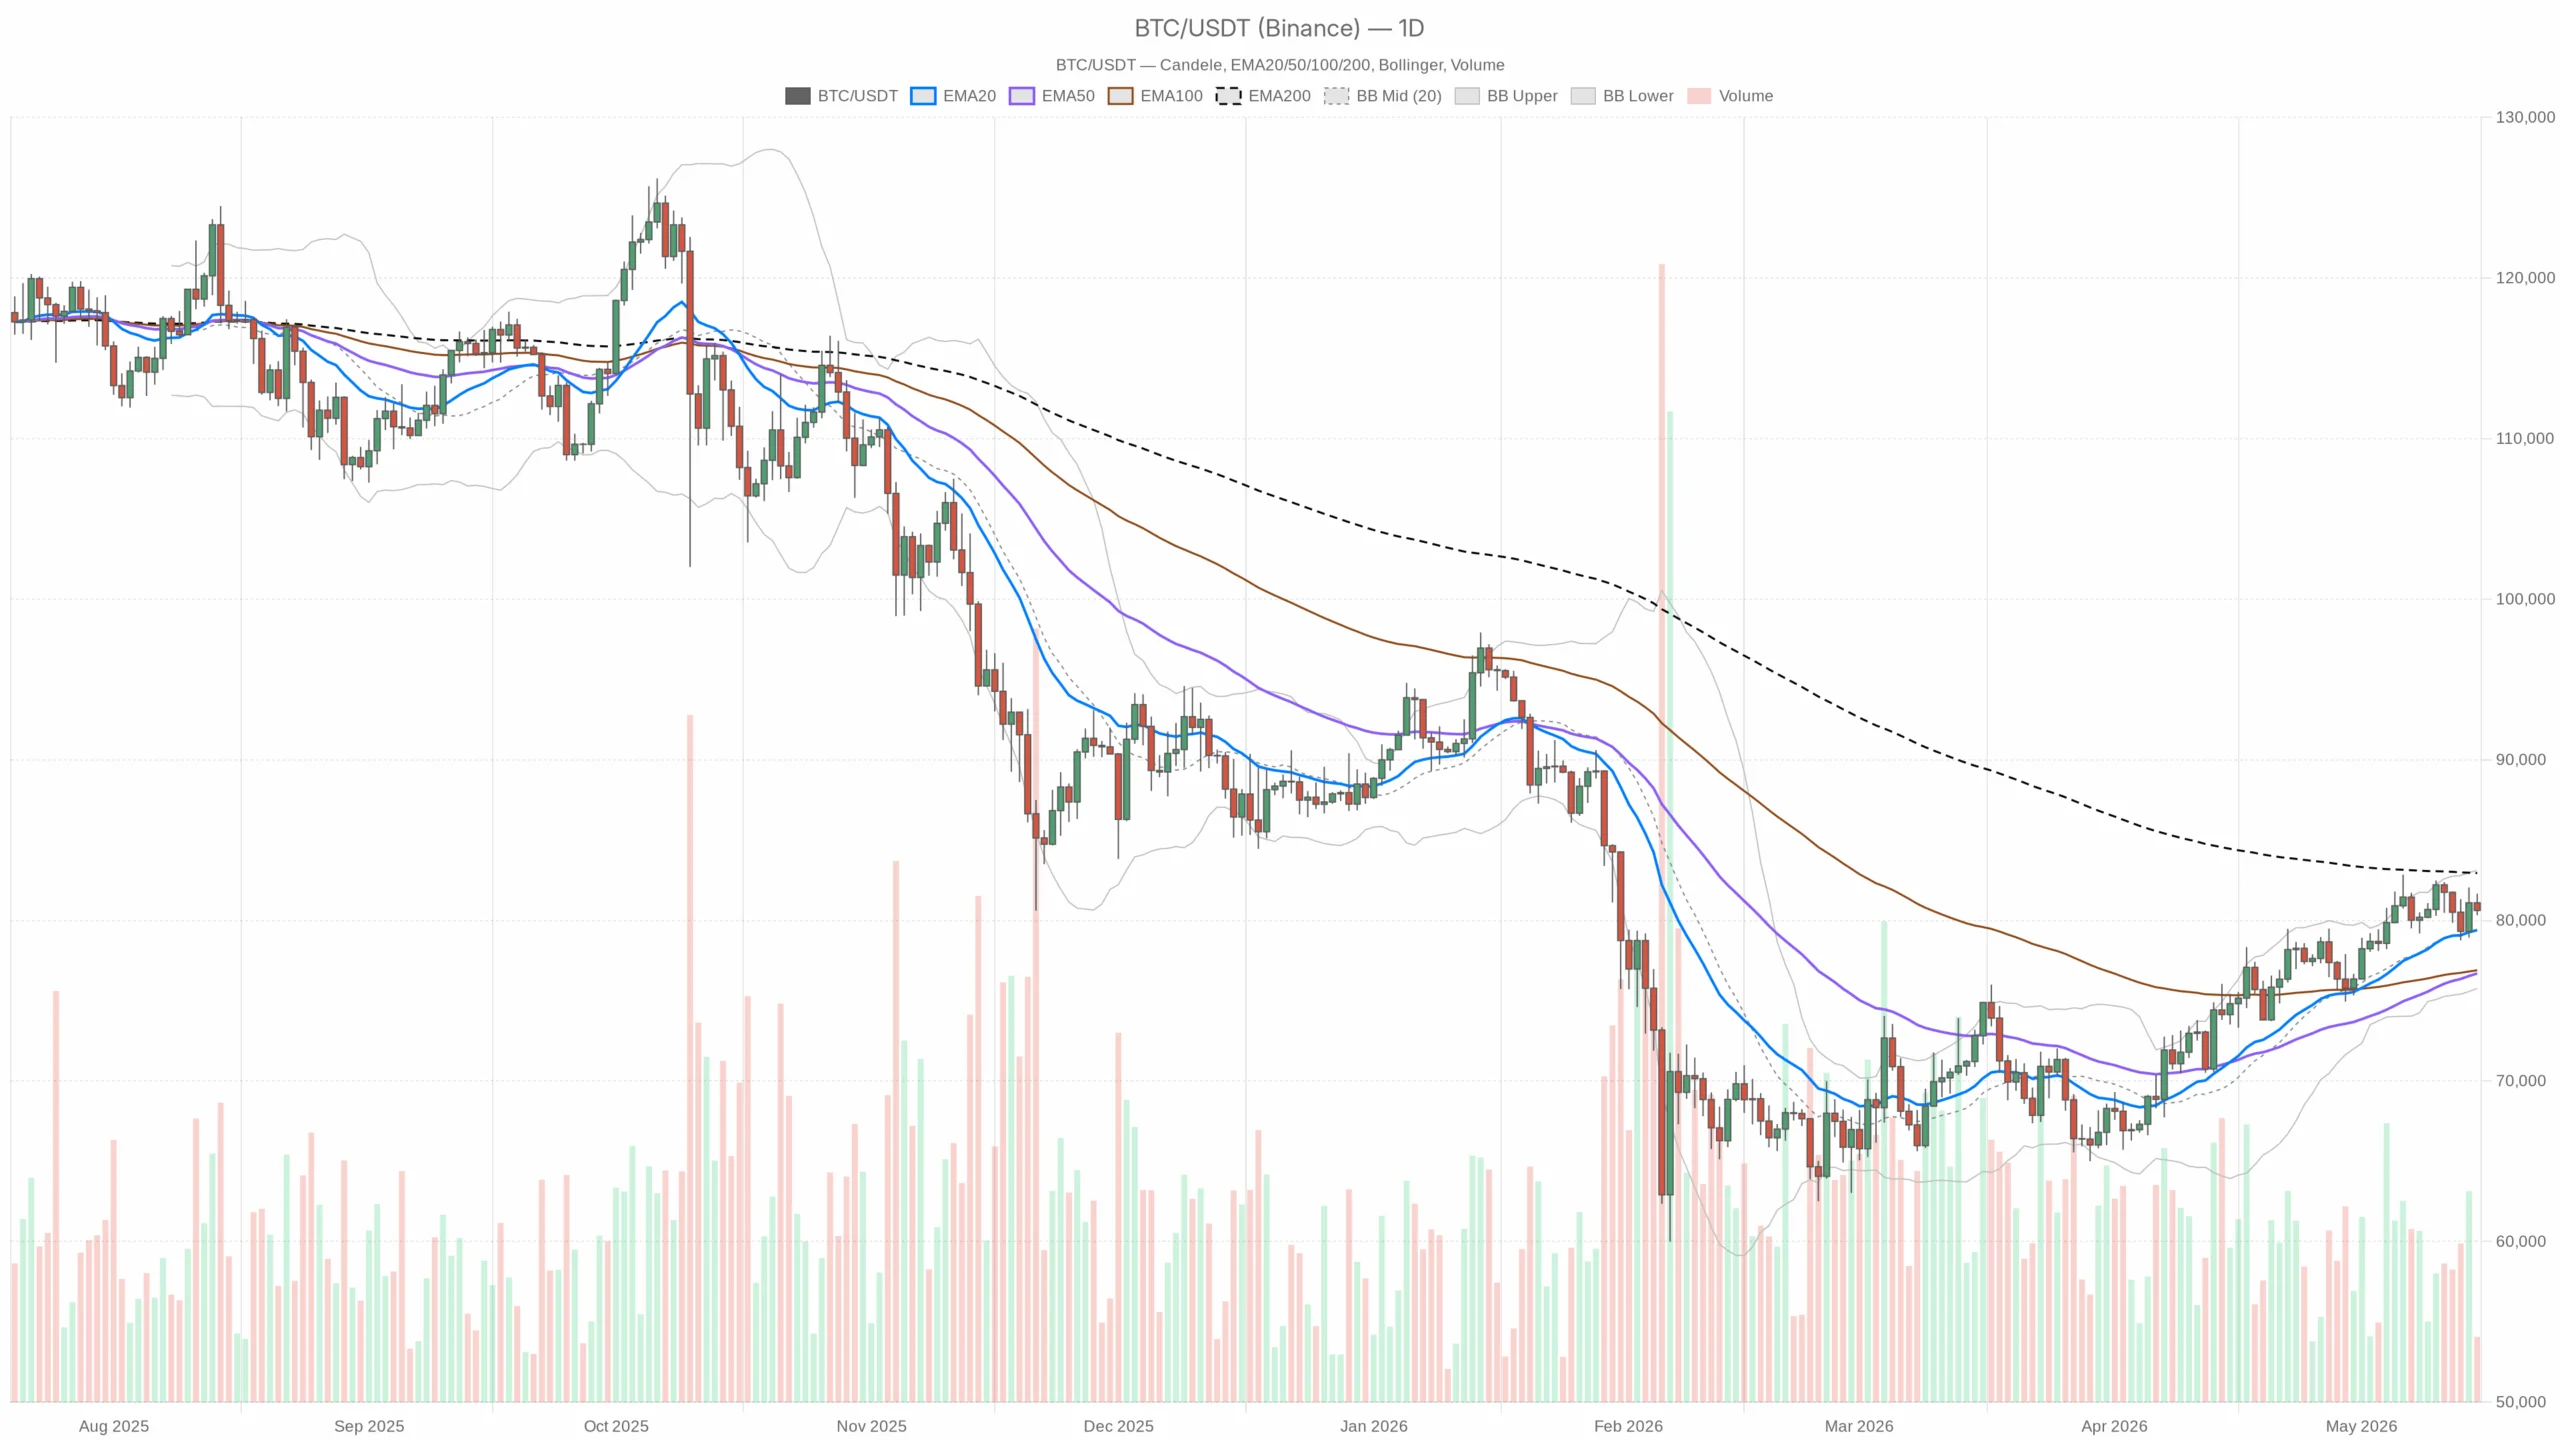
Markets trade with Bitcoin price today hovering near $80.6k as a heavy ceiling around $83k tempers momentum.
Thesis — What matters right now
The price of Bitcoin today is orbiting $80.6k, grinding just under a thick ceiling near $82.9k–$83.1k. The market has rebuilt some structure above the 20- and 50-day averages, but the 200-day still sits overhead as the final boss. With $BTC dominance at 58.4% and the Fear & Greed Index at 43 (Fear), capital is defensive inside crypto. It is concentrated in $BTC. Moreover, that mix keeps dips supported but makes breakouts prove-it affairs.
The dominant force is range control: buyers are defending the $79k–$80k shelf, sellers reloading into $81.4k–$83k. However, momentum has improved, though not enough to bulldoze the 200-day yet. Until that changes, think rotational chop with directional bursts.
Main scenario (D1): Neutral. Price is above the 20/50-day EMAs but still below the 200-day, and daily momentum has not fully flipped. The bias turns cleanly bullish only on acceptance back above the 200-day.
Market logic across timeframes
Daily (macro bias): As of 15 May 2026, structure has healed: $BTC closed at $80,616 above the 20D EMA ($79,391) and 50D EMA ($76,695), but the 200D EMA at $82,941 and the daily upper band near $83,095 cap rallies. RSI near 58 is constructive, while a slightly negative MACD histogram warns momentum is not yet unanimous. Translation: range with a bullish lean, but the long-term gate is still shut at ~83k.
1H (tactical check): $BTC at $80,636 sits just below the 1H 20EMA ($80,792), near the 50EMA ($80,614), and above the 200EMA ($80,521). RSI around 48 and a soft MACD histogram keep the intraday tone flat to soft. However, the hourly mid-band near $81,147 is the first spot bulls need to reclaim to put $81.4k back in play.
15m (execution lens): Price hovers around the 15m 200EMA ($80,620) with the 20/50EMAs above. Short-term RSI in the low 40s and a tiny positive MACD histogram hint at a tentative base, not a confirmed push. That said, the 80.55k–80.70k pivot cluster is the local battleground for triggers.
Scenarios and levels
Within this setup, Bitcoin price today reflects tight range control between $79k–$80k support and $81.4k–$83k supply.
Bullish path: Hold above $80.0k–$80.1k and reclaim $80.9k (daily pivot) quickly. Acceptance above $81.15k (1H mid-band) opens $81.4k (D1 R1). A strong push through $81.4k sets a run at the $82.9k–$83.1k resistance band (200D EMA/upper band). A daily close above ~$82.9k unlocks continuation toward higher ranges.
Bearish path: Lose $80.1k (D1 S1) and the $80k round number, then pressure the $79.4k zone (20D EMA / daily mid-band). A daily close below ~$79.4k hands back the initiative to sellers and exposes the wider range toward the daily lower band near $75.8k.
Invalidation: For the bullish path, a daily close back below the 20D EMA (~$79.4k) would invalidate the immediate upside. For the bearish path, a decisive daily close above the 200D (~$82.9k) would invalidate further downside expectations.
Indicator evidence (with quick reads)
RSI
– D1: 57.9 — Buyers have the ball with room before fatigue.
– H1: 48.5 — Intraday balance; no clear edge.
– 15m: 43.7 — Short-term dip trying to stabilize.
MACD
– D1: line 1,538 vs signal 1,738; hist -199 — Momentum improved but not fully confirmed; bulls have not sealed it.
– H1: line 82 vs signal 195; hist -113 — Mild downside drift intraday.
– 15m: line -103 vs signal -119; hist +16 — Early uptick; bears easing locally.
EMAs
– D1: Price $80,616 above 20D ($79,391) and 50D ($76,695) but below 200D ($82,941) — Medium-term trend constructive; long-term cap at ~83k remains.
– H1: Price just under 20EMA ($80,792), near 50EMA ($80,614), above 200EMA ($80,521) — Chop around equilibrium; small pushes matter.
– 15m: Price below 20EMA ($80,746) and 50EMA ($80,874), hugging 200EMA ($80,620) — Micro softness but stabilizing at a key line.
Bollinger Bands
– D1: Mid $79,428; Up $83,095; Low $75,760 — Sitting between mid and upper band; headroom to ~83k but supply lurks there.
– H1: Mid $81,147; Up $81,959; Low $80,336 — Trading below the middle; reclaiming $81.1k is step one for bulls.
– 15m: Mid $80,683; Up $81,016; Low $80,351 — Tight local range; energy building for a move.
ATR (volatility)
– D1 ATR14: ~$1,913 — Expect ~2.4% daily swings; one-leg risk is not trivial.
– H1 ATR14: ~$405 — Typical hourly wiggle room.
– 15m ATR14: ~$179 — Micro noise can eat tight stops.
Pivots (spot is ~$80,626)
– D1: PP $80,865; R1 $81,416; S1 $80,066 — Daily battleground at ~$80.9k; first resistance $81.4k; first support ~$80.1k.
– H1: PP $80,620; R1 $80,686; S1 $80,570 — Intraday balance centered at $80.6k.
– 15m: PP $80,617; R1 $80,680; S1 $80,564 — Execution line sits right where price is trading.
How to think about positioning
We are in a classic structure vs. momentum standoff: structure favors bulls above the 20/50D, while momentum has not fully confirmed as the 200D caps price. Intraday, the 80.55k–80.70k cluster is the fulcrum. Moreover, pushes above it can accelerate quickly given rising 24h volume, while slips under $80.1k risk a slide into the 79s.
Given a daily ATR near $1.9k and sentiment stuck in Fear, expect whipsaws at the range edges. Position sizing and stops should respect current volatility. That said, until the 200D is reclaimed or $79.4k is lost on a daily close, the path of least resistance is range trading with a bullish tilt into pullbacks, while the 83k lid stays in charge.
In sum, the market defends $79k–$80k while supply reloads near $83k. Acceptance above the 200D would flip the bias cleanly higher; a daily close below ~$79.4k would hand control back to sellers.


