

Bitcoin trades at $79,642 on May 9, holding above the 20 EMA after a multi-month recovery but facing its first ETF outflow day in nearly a week, with Fundstrat’s Tom Lee drawing a clear line in the sand at $76,000 for May’s monthly close.
What the Daily Chart Says About $80,000
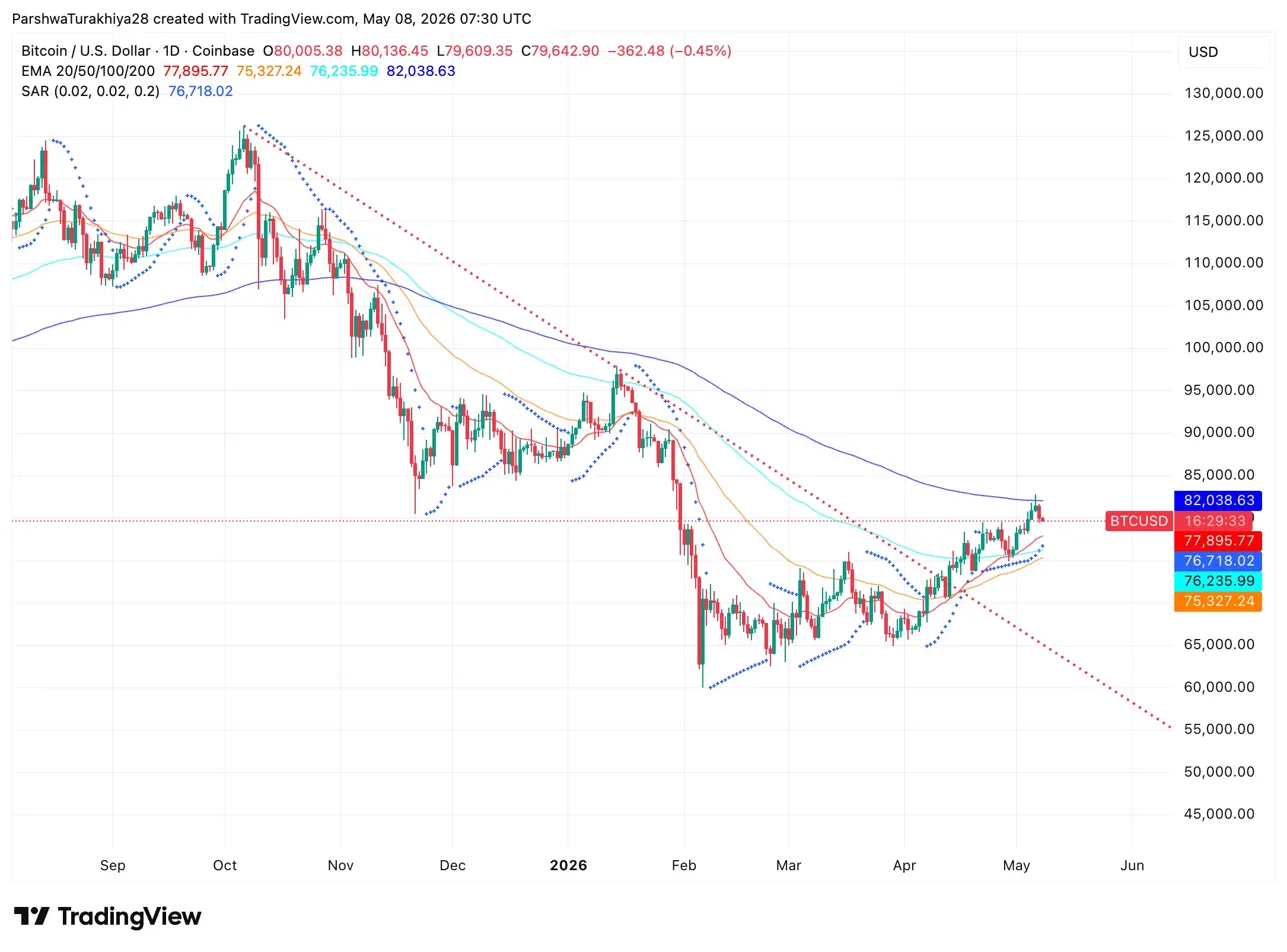
The daily chart shows $BTC has broken above a descending trendline that had capped price since the October 2025 peak near $126,000. The 20 EMA at $77,895 and 50 EMA at $75,327 are now both below price, a positive shift after months of acting as resistance. The Parabolic SAR at $76,718 has flipped bullish, sitting below current price for the first time since the recovery began.
The 200 EMA at $82,038 is the wall. Price tagged $80,136 intraday on May 8 and pulled back, leaving a visible rejection. Until $BTC closes a daily candle above $82,038, the broader EMA structure remains bearish on the macro timeframe.
Key levels:
- Resistance: $82,038 (200 EMA), $85,000 prior structure
- Support: $76,718 (SAR), $75,327 (50 EMA), $76,000 (Tom Lee’s bear market line)
- Reclaimed: 20 EMA and 50 EMA both flipped to support
ETF Outflows Break a Five-Day Streak
Bitcoin spot ETFs recorded $277.50M in net outflows on May 7, the first negative day after five consecutive sessions of inflows. BlackRock’s IBIT led with $98.02M out, followed by Fidelity’s FBTC at $128.99M. Total net assets across all US $BTC spot ETFs still sit at $106.77B, representing 5.67% of Bitcoin’s market cap, and cumulative inflows remain at $59.49B.
Related: Zcash Price Prediction: ZEC Holds Bullish Structure After 64% Surge, Eyes Breakout Above $600
One outflow day after a strong inflow streak is not alarming on its own. The five prior sessions pulled in over $1.4B combined, so some profit-taking at resistance near $80,000 is expected behavior.
$BTC Derivatives: What Falling OI and Volume Mean for the Next Move
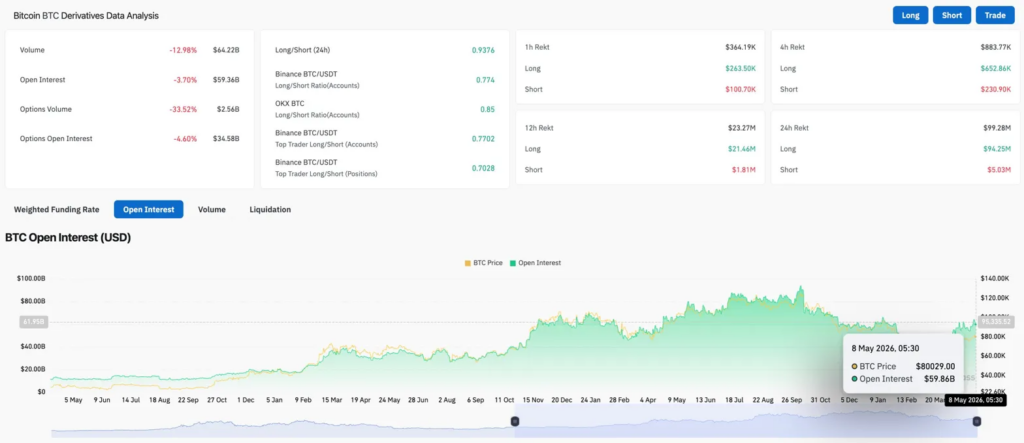
Volume dropped 12.98% to $64.22B while open interest fell 3.70% to $59.36B. When both move lower together, it signals traders closing positions rather than piling in new shorts or longs. The long/short ratio on Binance sits at 0.774, slightly short-biased among retail accounts, while top traders on Binance show a ratio of 0.7028, also leaning short.
Over the past 24 hours, $94.25M in longs were liquidated against $5.03M in shorts. That lopsided liquidation map means the market squeezed overleveraged longs on the $80,000 rejection, not bears.
Tom Lee at Consensus 2026: Why $76,000 Is the Only Number That Matters
Speaking at Consensus 2026 in Miami, Fundstrat’s Tom Lee argued Bitcoin has never recorded three consecutive positive monthly closes inside a bear market. March and April both closed green. A May close above $76,000, which April already ended at $76,300, would make it three in a row and, by Lee’s read, confirm the bear market is over.
Related: Solana Price Prediction: Crypto Bill Markup Next Week as SOL ETFs Cross $1B
He also pointed to tokenization and AI-driven finance as the structural drivers of the next cycle, noting stablecoin volumes have already surpassed Visa and that the $300 trillion securities market is migrating on-chain.
$BTC Price Prediction for May 9
- Upside: Daily close above $82,038 (200 EMA) opens a run toward $85,000–$88,000. ETF inflows resuming would confirm the dip was absorbed. Extended target $95,000 if May closes strong.
- Downside: Failure to hold $77,895 (20 EMA) on a daily close brings $75,327 and the SAR level at $76,718 into play fast. A May close below $76,000 would invalidate Lee’s bull case entirely.

