

 1
1
Bitcoin is holding near $81,000, with one chart pointing to a possible move toward the $84,000 CME gap if buyers defend support. However, $BTC still needs a daily close above the 200EMA near $82,048 and the 200MA near $83,136 to confirm stronger upside momentum.
Bitcoin Holds $81,000 as Chart Points to $84,000 CME Gap Test
Bitcoin traded near $81,164 on the daily $BTC/$USDT chart, while the chart shared by Ted on X showed price holding above the key $81,000 support level.
The chart marks $80,600 as the main short-term support line. $BTC is trading slightly above that level, which keeps the recovery structure active after the sharp rebound from the $65,800 area.
Ted said Bitcoin could fill the $84,000 CME gap if $BTC continues to hold above $81,000. The chart supports that view because the next marked resistance zone sits around $83,800 to $85,000. A move into that area would test the first major supply zone above the current price.
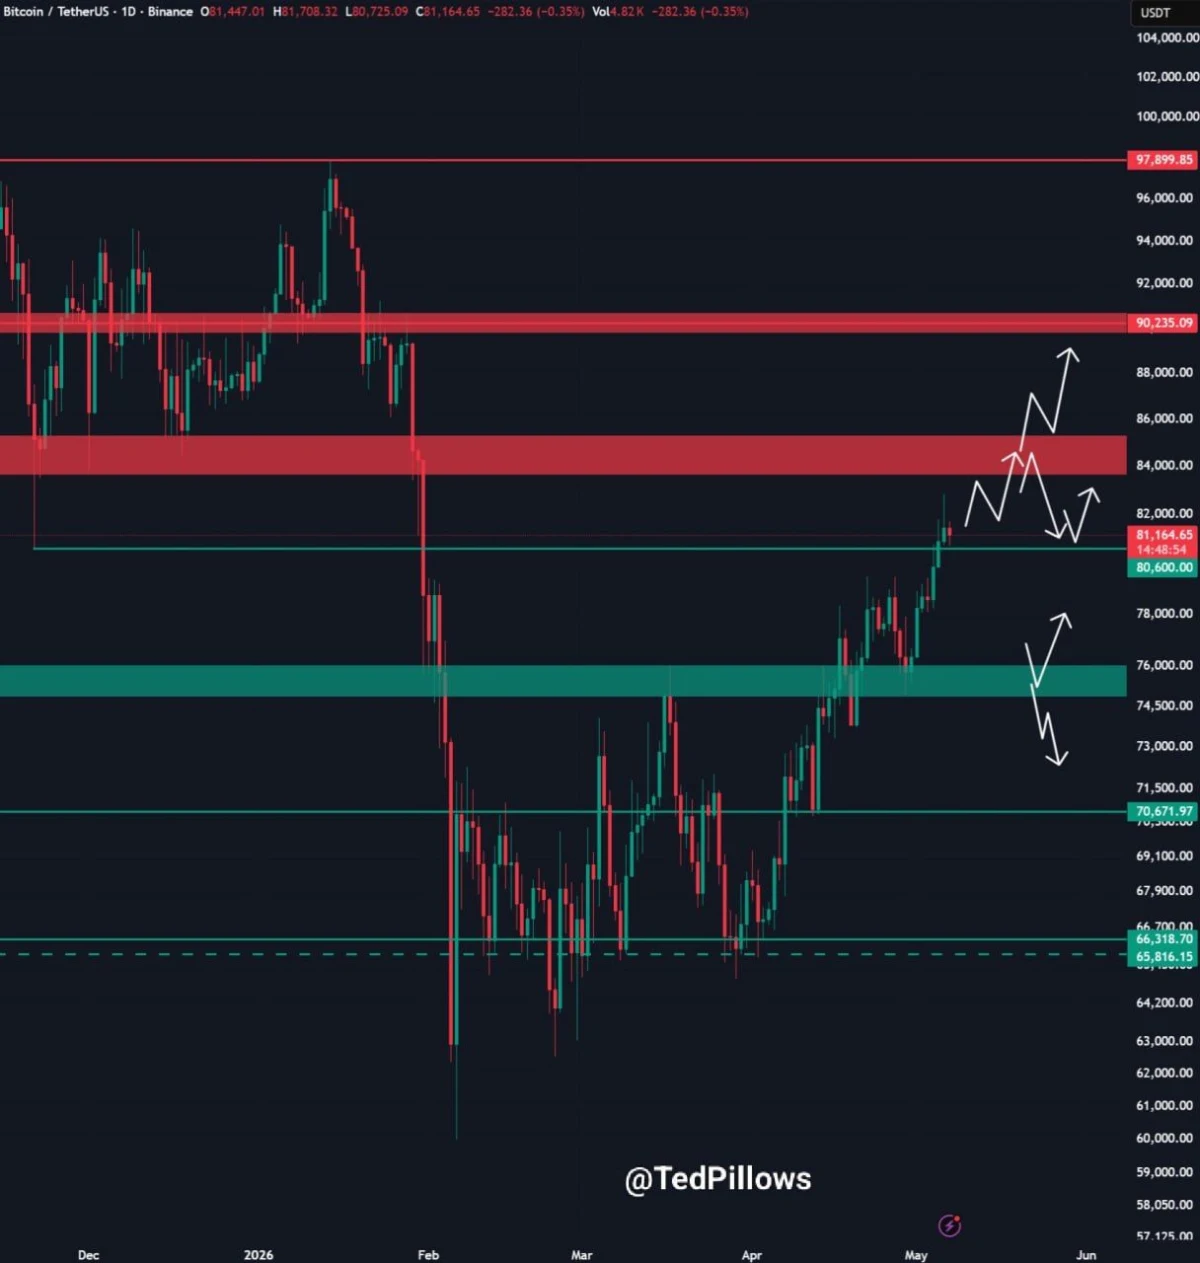
Bitcoin Price Support Chart. Source: Ted on X
However, the chart also shows two possible paths from the current level. If buyers defend $81,000, $BTC could move toward $84,000 first, then target the $90,235 resistance area. That level sits near the next major red zone on the chart.
Still, failure to hold $81,000 could weaken the setup. In that case, $BTC may pull back toward the green support zone near $74,500 to $76,000. A deeper move below that area would bring the $70,671 and $66,318 levels back into focus.
Bitcoin’s short-term structure remains constructive as long as price stays above $81,000. However, buyers still need a stronger breakout above the $84,000 to $85,000 zone to confirm continuation toward $90,000.
Bitcoin Stalls Below 200 Day Averages as $BTC Holds Key November Low Area
Bitcoin traded near $81,085 on the daily $BTC/$USDT perpetual chart, while the chart shared by Daan Crypto Trades on X showed $BTC failing to close above the daily 200MA and 200EMA.
The chart marks the daily 200EMA near $82,048 and the daily 200MA near $83,136. Bitcoin briefly pushed into that zone but could not secure a daily close above it. That keeps the moving average area as the main short-term resistance.
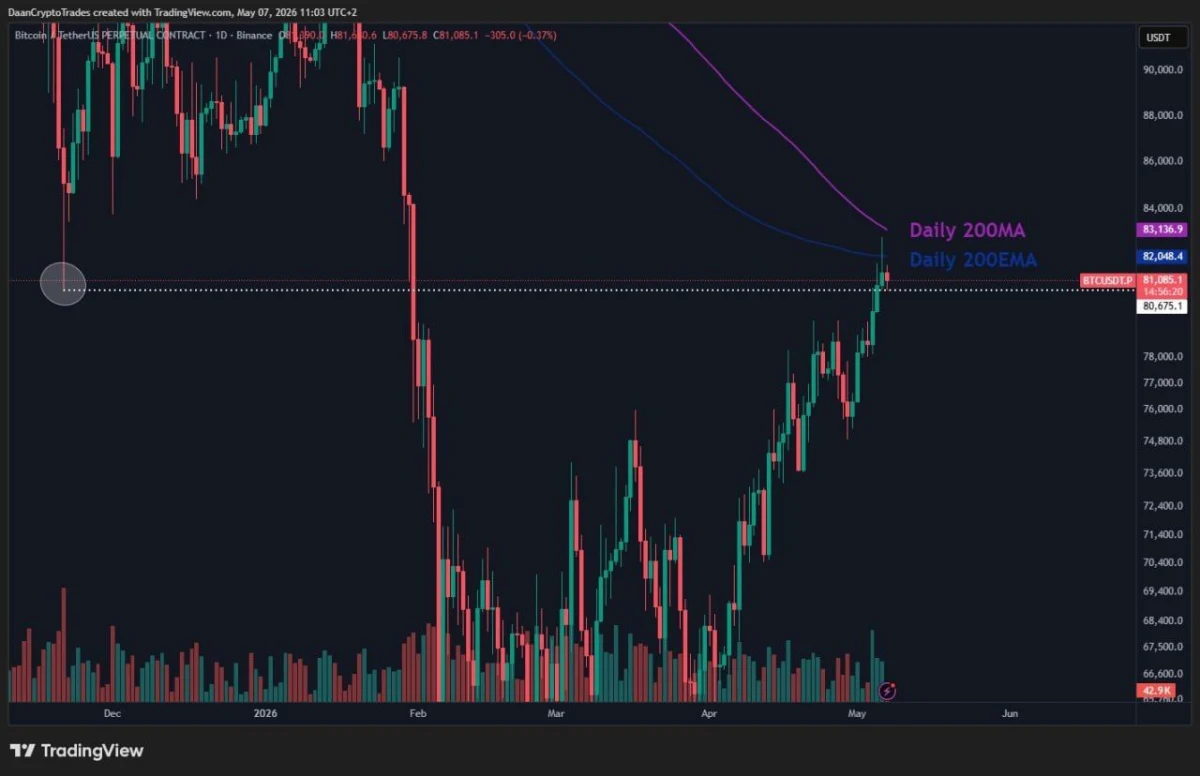
Bitcoin 200MA and 200EMA Chart. Source: Daan Crypto Trades on X
Daan Crypto Trades said Bitcoin is now consolidating above the November low. The chart shows that area near the $81,000 zone, where $BTC is trying to hold after its recovery from the February and March lows.
This level matters because Bitcoin has already moved sharply from the lower range near $65,000 to above $80,000. However, the rally now needs confirmation above the 200 day averages. Without that close, buyers have not fully regained control on the daily chart.
If $BTC closes above $82,048 and then $83,136, the move could strengthen the recovery and open the way toward higher resistance levels. However, if Bitcoin loses the November low area, the chart could shift back toward support near the upper $70,000 range.
For now, Bitcoin’s mid and high timeframe setup depends on this zone. $BTC is holding the key area, but it still needs a confirmed close above the daily 200MA and 200EMA to show stronger continuation.
