


 4
4
Bitcoin traded near $81,359 on the 4 hour $BTC/USD chart shared by Man of Bitcoin. The chart shows $BTC moving inside a rising channel, while the short-term wave structure remains unclear.
Man of Bitcoin said the key levels are well defined, even though the micro structure has not confirmed a clear path. The main support level sits at $74,917. As long as Bitcoin holds above that level, continuation without a deep pullback remains possible.
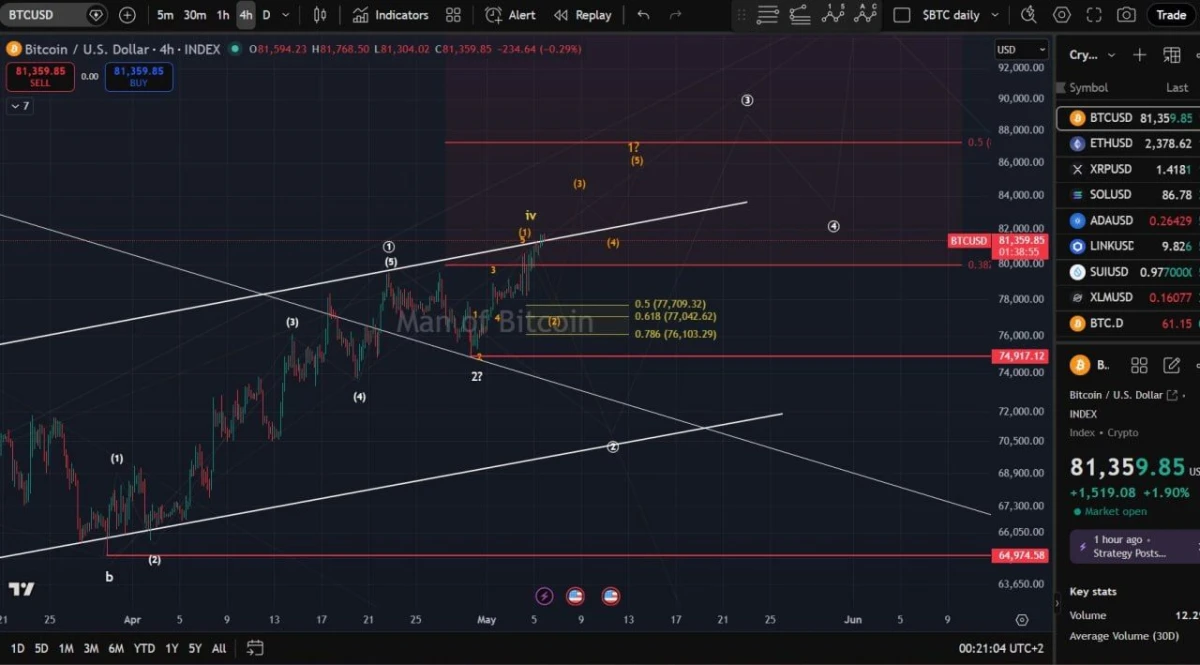
Bitcoin Channel Breakout Chart. Source: Man of Bitcoin on X
The chart also marks a highlighted support zone between $76,103 and $77,709, based on Fibonacci retracement levels. These levels include the 0.5 level near $77,709, the 0.618 level near $77,042, and the 0.786 level near $76,103.
However, Man of Bitcoin still expects a possible retrace into that support zone before stronger continuation. A pullback into this area would keep $BTC above the wider invalidation level, as long as price does not lose $74,917.
The upside level also remains clear. A decisive breakout above the rising channel would suggest that wave 2 has already bottomed. In that case, $BTC could continue toward higher targets marked near $87,000 and $90,000.
For now, Bitcoin remains above key support but below the upper breakout zone. A clean channel breakout would strengthen the bullish structure. However, a drop below $74,917 would weaken the setup and raise the risk of a deeper correction.
Bitcoin Dominance Rises as Altcoin Pairs Stay Under Pressure
Bitcoin dominance traded near 61.21% on the 3 day $BTC.D chart shared by Daan Crypto Trades. The chart shows $BTC dominance rising from the yearly open near 59.55%, while Bitcoin has bounced and many altcoin pairs have weakened against $BTC.
Daan Crypto Trades said $BTC.D has been rising over the past few weeks because Bitcoin has held stronger than altcoins. That means Bitcoin is taking a larger share of the total crypto market while ALT/$BTC pairs continue to lose ground.
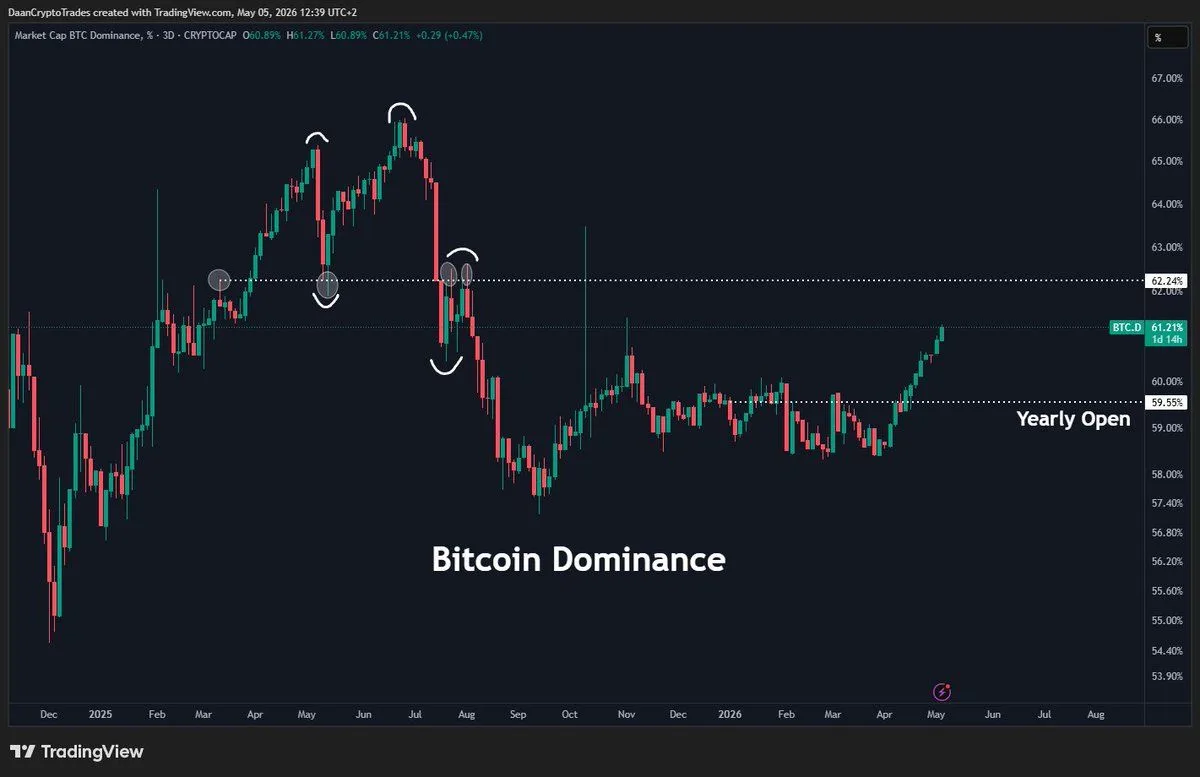
Bitcoin Dominance Chart. Source: Daan Crypto Trades on X
The chart shows the next marked resistance near 62.24%. Bitcoin dominance previously reacted around that zone, so a move into this area could decide whether $BTC keeps gaining market share or pauses.
Ethereum is also part of the pressure on altcoins. Daan noted that ETH/$BTC is sitting near its February lows, which weighs on the broader Bitcoin dominance chart because Ethereum remains one of the largest non-Bitcoin assets.
For now, $BTC dominance remains above the yearly open and continues to move higher. A break above 62.24% could extend Bitcoin’s market share lead, while rejection from that level could give altcoin pairs room to recover.
