


 5
5
Bitcoin — $80,000 or bust. That is the only line that matters right now. Early May 4, 2026, Bitcoin surged back above $80,000 for the first time since January 31.
It briefly touched $80,500. Market watchers attribute the move to robust spot ETF inflows, significant short covering, and improving on-chain indicators. The level has been breached. Whether it holds is a different question entirely.
Why $80K Is More Than Just a Number
A massive wall of short-side liquidity has accumulated at $80,000. Analysts warn that a decisive close outside the $75K–$80K range will define May’s trend.
A daily close above $80,000 opens the path toward $84,000–$85,500 — with a potential short squeeze accelerating the move.
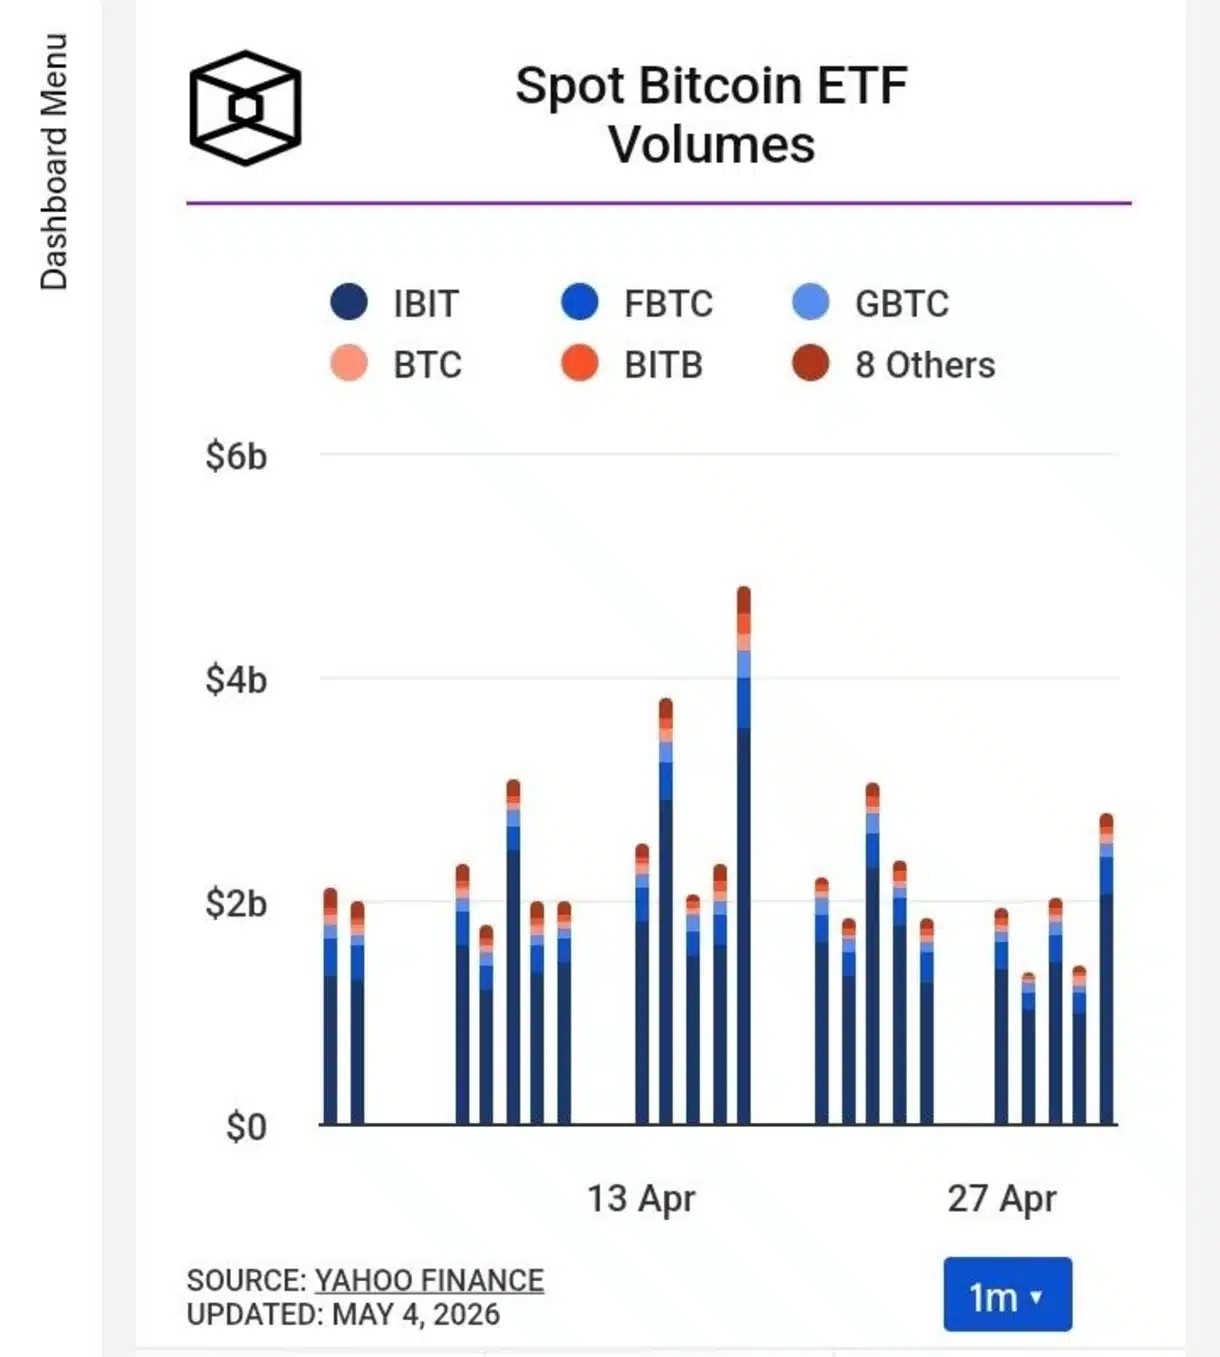
The level sits within a key supply zone of roughly $100 million in sell orders. Spot Bitcoin ETFs recorded nearly $2 billion in net inflows in April.
Over $600 million has already flowed in during May. The 200-day moving average at $82,228 is the key level to watch.
Bitcoin hasn’t closed above it since October 2025. Breaking it would mark the first genuine trend reversal since the February correction began.
What the Charts Are Telling Us
BTCUSD Weekly (1W): As of May 04, 2026 (14:12 UTC), Bitcoin trades at $78,850.51, up +0.38% on the week. The Parabolic SAR sits at $82,067.73 — still above price.
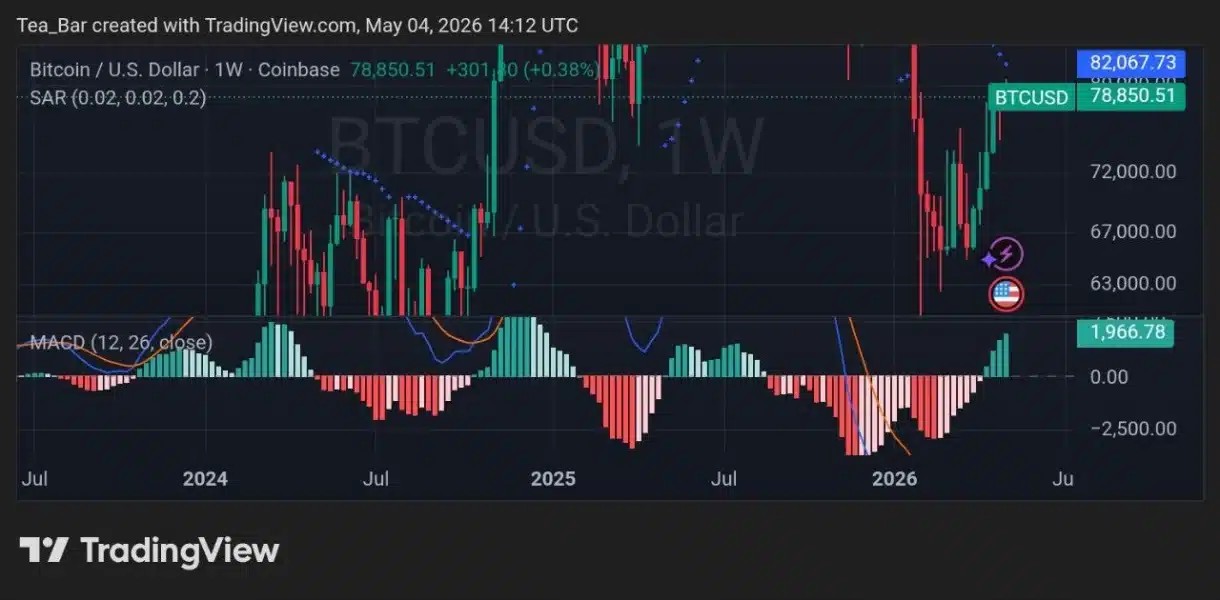
The weekly trend remains technically bearish. But the MACD histogram has flipped strongly green at +1,966.78. That is the most bullish weekly MACD reading since early 2025.
The MACD and signal lines have crossed upward and are diverging with momentum.
Every major $BTC recovery since 2023 has begun with exactly this kind of histogram expansion from deeply negative territory.
BTCUSD Daily (1D): Bitcoin trades at $78,788.38, up +0.30%. The Parabolic SAR at $74,986.18 has flipped below price — a bullish signal on the daily timeframe.
The MACD line at +1,600.26 sits above the signal. The histogram at -56.66 is near zero. Momentum is still building.
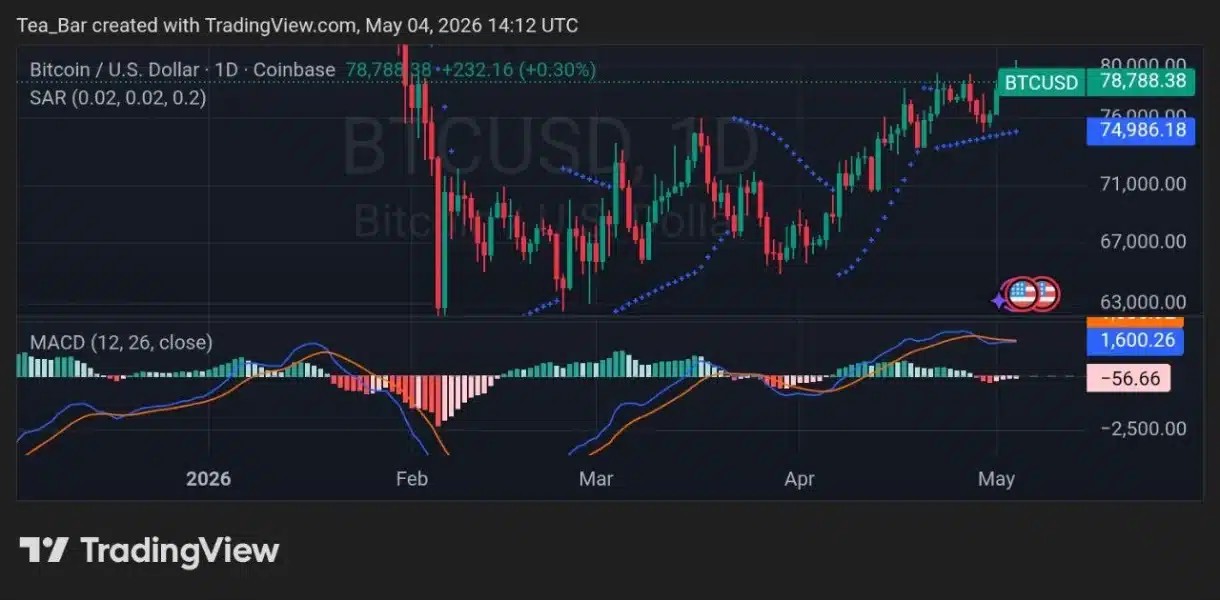
The daily SAR flip confirms the short-term trend has technically reversed. The key level to hold on a daily close is $78,100 — the True Market Mean.
One Level, One Answer
A volume profile analysis shows thin resistance between current levels and the all-time high region near $126,000.
Price action from mid-2025 created a volume gap between $80,000 and $100,000. A decisive break above could encounter minimal resistance until six figures.
The ETF flows say the bid is building. The charts say the setup is there. May 2026 may finally answer whether this was a real recovery — or just another rally that couldn’t close the deal.
Disclaimer:
This article is for informational purposes only and does not constitute financial, investment, or trading advice. The views expressed are based on publicly available data, market observations, and the author’s interpretation at the time of writing. Cryptocurrency markets are highly volatile and unpredictable, and past performance or current technical setups do not guarantee future results. Readers should conduct their own research and consult with a qualified financial advisor before making any investment decisions. TechGaged does not accept liability for any losses incurred based on the information presented.
