


 6
6
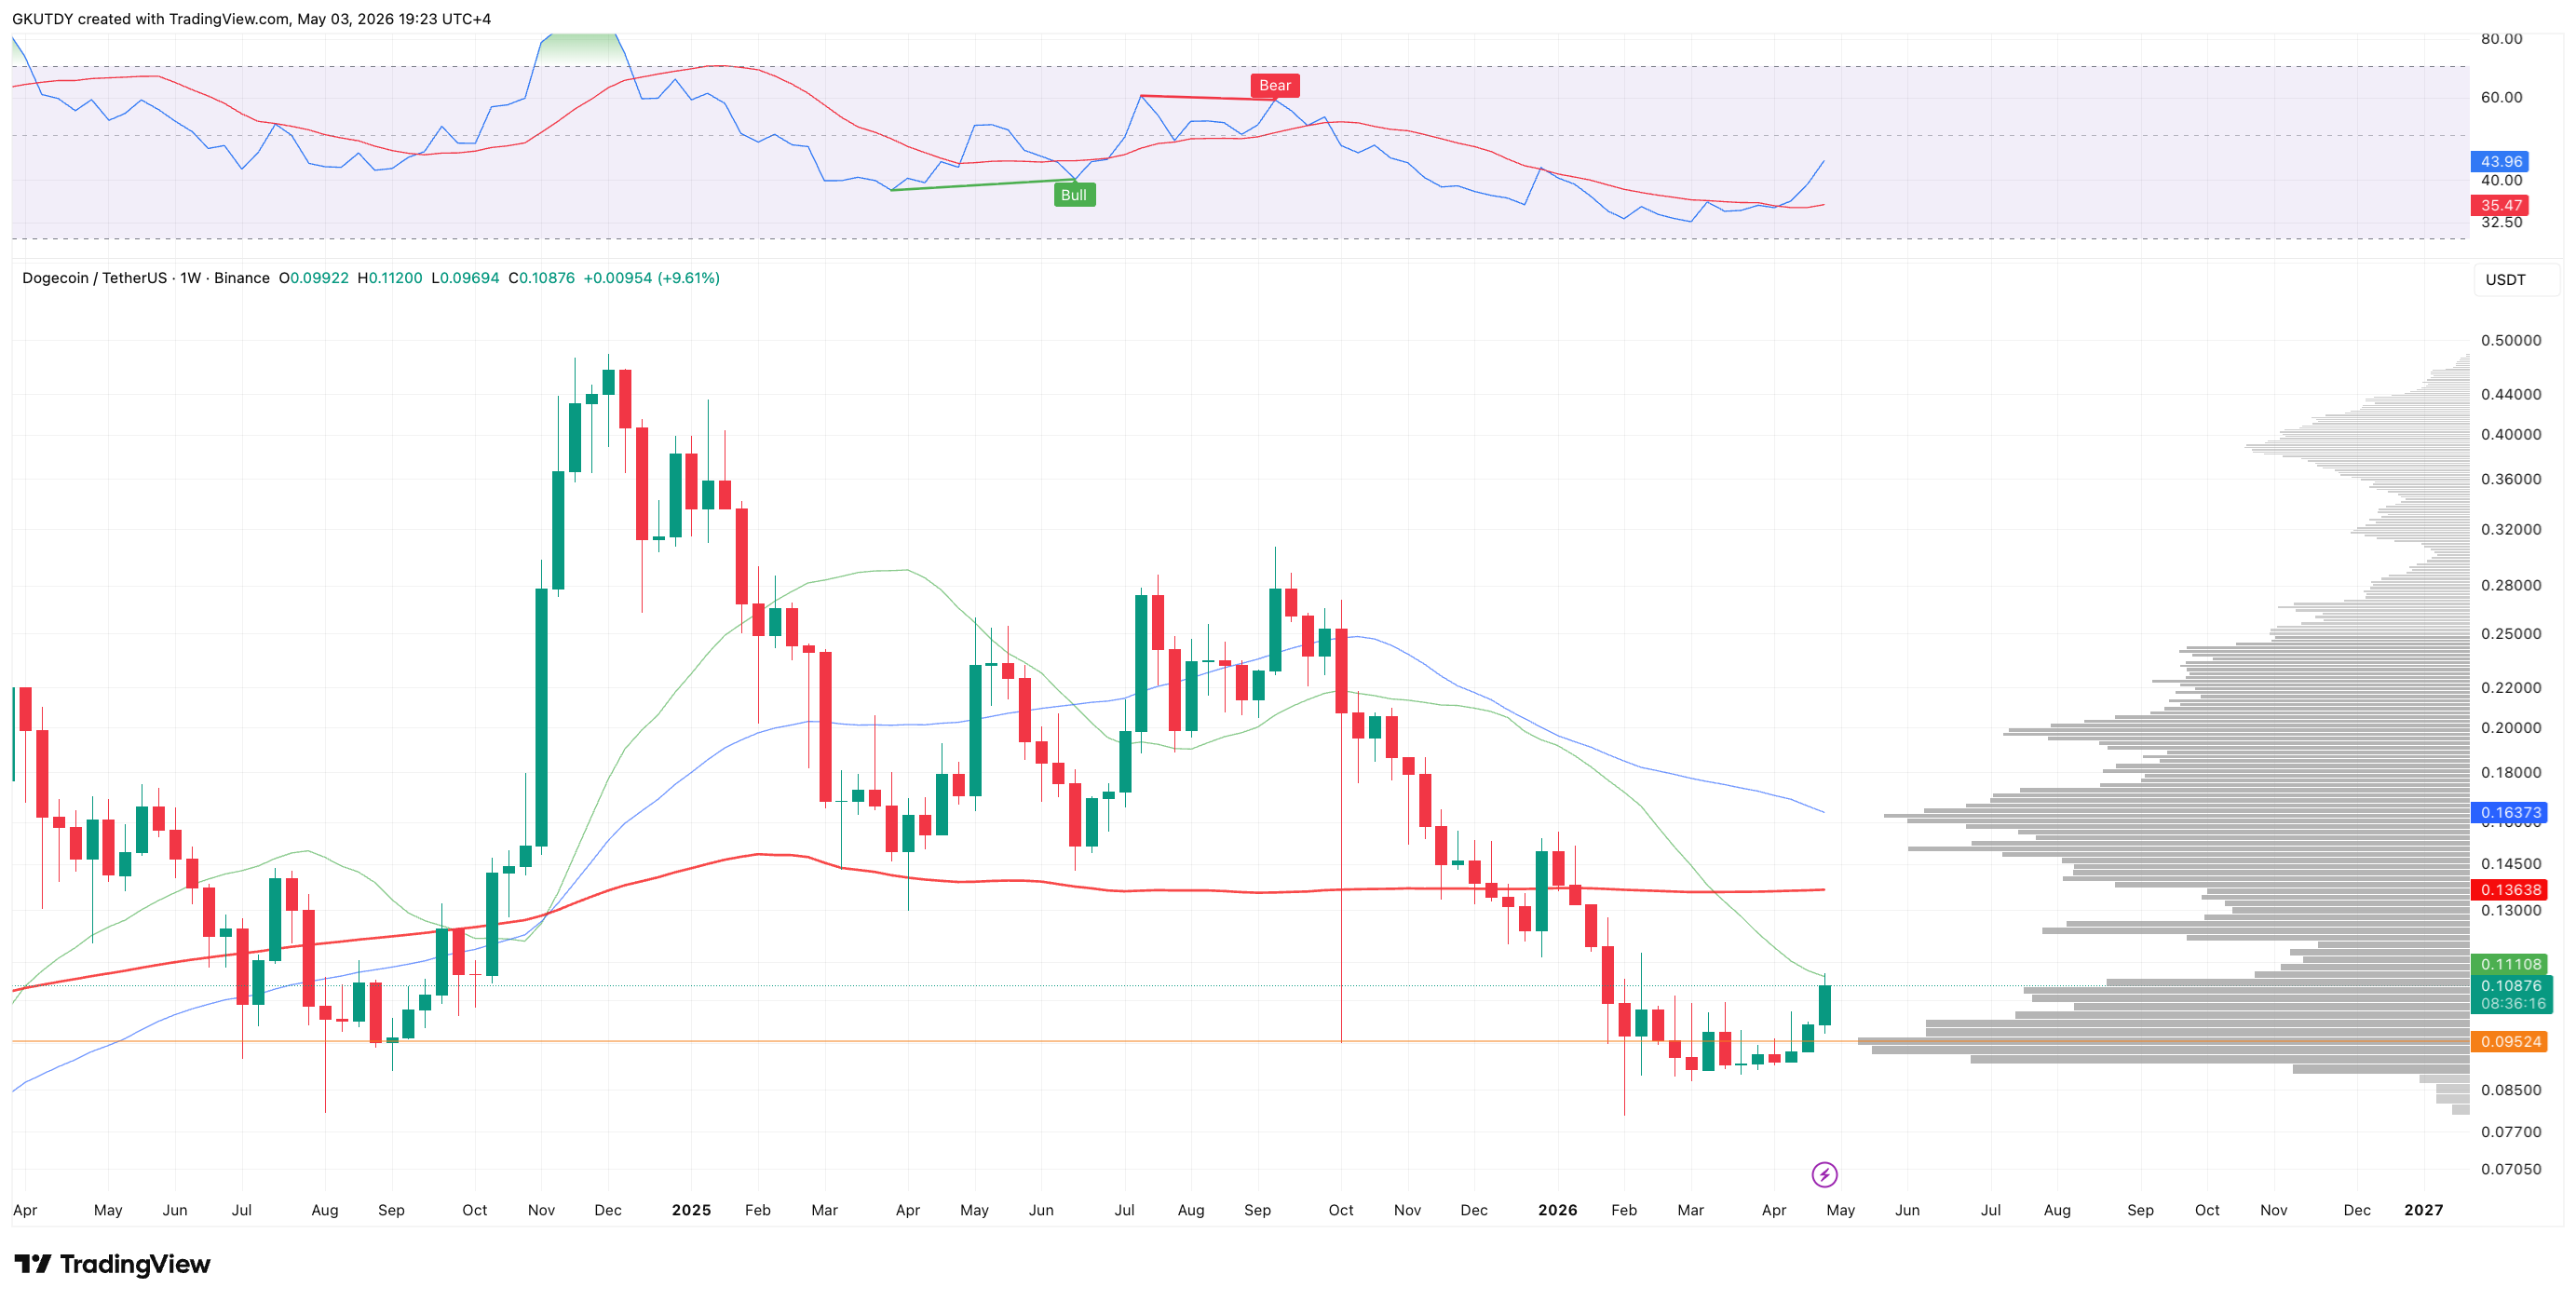
As the crypto market closes another week, the main focus is on Dogecoin's technical duel with the $0.111 level. This threshold, represented by the 23-week moving average on TradingView, has become a temporary ceiling for the meme coin after an impressive 20% rally over the past three weeks.
However, the roadmap for a breakout has already been drawn by the world's leading cryptocurrency.
This week, Bitcoin ($BTC) faced identical resistance around $78,330, its own 23-week MA. Although the previous week closed slightly below this level, the current weekend has shifted the balance of power.
A more than 3% rise in $BTC allowed the price to establish itself above the average, forming a pin bar candle on the weekly chart.
$DOGE's path to $0.136 depends on Bitcoin
For Dogecoin, which historically correlates with $BTC as the most sensitive proxy asset, this is an important signal. If $DOGE maintains its pace and follows the leader, the coming week of May could become decisive.
If Dogecoin manages to convert the $0.111 resistance into support, the technical setup opens room for a move toward a more long-term target - the 200-week moving average at $0.136. This move would represent a return to mean values, a so-called mean reversion scenario in traditional finances, and deliver about 25% growth from current levels.
The current dynamics suspiciously resemble the post-April rally of 2025. Back then, after a period of local stagnation at the end of April, May became the month of realizing deferred demand.
Right now, the Dogecoin market is in a waiting phase: $BTC's impulse has already been confirmed, and now the only question is whether $DOGE has enough liquidity to complete this scenario within the next 7 days.

