


 4
4
Bitcoin closed April 2026 with a 12.07% monthly gain, its strongest performance of the year and a reversal of earlier losses. The move follows a volatile first quarter, where January and February recorded declines of 10.17% and 14.4%, respectively, before March posted a 1.81% increase. The April recovery places Bitcoin back into positive territory for the year’s recent trend, supported by shifting market activity, renewed accumulation, and continued volatility in spot flows.
Monthly Performance Reflects Volatile Start to 2026
Data shows Bitcoin’s monthly returns in 2026 have fluctuated. After early declines, the asset rebounded through March and April, with gains of 1.81% and 12.07%. Separate figures also indicate April gains near 11.87%, alongside a slight 0.25% increase in May, pointing to stabilizing conditions following earlier disruptions.
BULLISH🚀
— Crypto Rover (@cryptorover) May 1, 2026
$BTC has closed 2 consecutive green monthly close for the first time since May 2025. pic.twitter.com/3DXFrLjHME
Historical comparisons strengthen the pattern of alternating gains and losses. In 2025, Bitcoin recorded a 20.49% increase in May but later declined by 5.64% in August and 3.49% in October. Similarly, 2024 included a 32.79% rise in November alongside a 14.76% drop in April. Earlier cycles show even higher swings, including a 36.78% gain in February 2021, followed by a 35.31% decline in May, while 2020 saw increases of 34.36% in April and 42.95% in November.
Market Activity and Accumulation Support April Gains
Bitcoin’s April performance occurred alongside increased accumulation activity. Large holders and retail wallet segments contributed to demand, while treasury-related purchases bolstered market support. Strategy reported its third-largest weekly acquisition, adding 34,164 $BTC as of April 20.
At the same time, Bitcoin’s market dominance rose to 58.2%, reflecting reduced activity in altcoins and tokens during the period. The broader crypto market faced pressure from multiple exploit incidents, which coincided with lower participation outside Bitcoin.
Spot Flow Data Highlights Liquidity Shifts
Spot market flow data shows continued volatility in investor positioning. Between July and early October, inflows ranged between $1 billion and $4 billion, but were frequently offset by outflows exceeding $5 billion. A major outflow event near mid-October approached $10 billion, followed by intermittent inflow spikes.
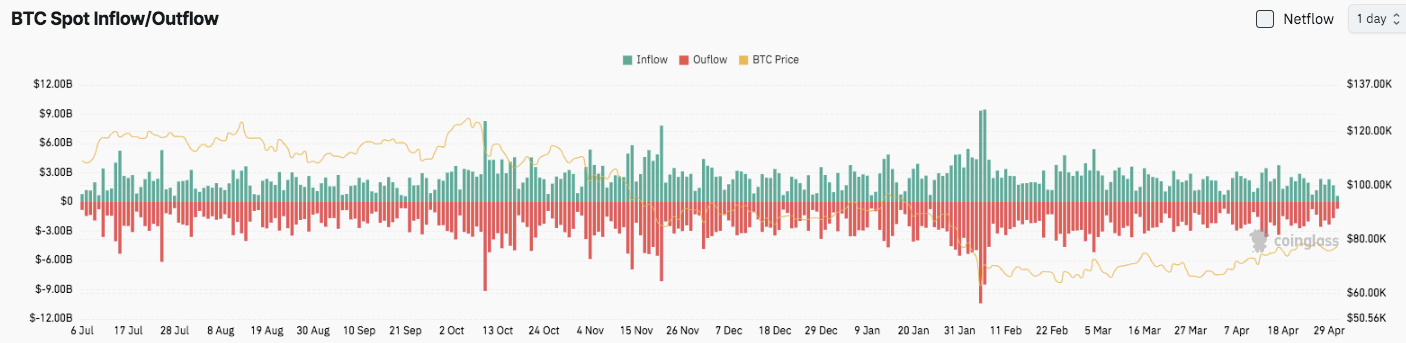
Source: Coinglass
The trend extended into early 2026, where one of the largest outflows, nearing $11 billion, aligned with a price decline toward $60,000. Subsequent weeks showed recovery toward $80,000, accompanied by more balanced inflow and outflow activity.
At the time of reporting, Bitcoin was trading at $77,441.37, with a 24-hour trading volume of $30.2 billion and a total market capitalization of approximately $1.55 trillion, maintaining its position as the top-ranked digital asset.
Related:Bitcoin Price Prediction May 2026: Can $BTC Break The 200-Day EMA In May?
