


 7
7
Bitcoin has reclaimed the $78,000 level, revisiting a price zone it last touched on the 17th of April and again on the 22nd of April, after previously trading within the range on the 3rd of February.
The move has reignited bullish sentiment across the market, with expectations building around a potential push toward $80,000. However, underlying data suggests the rally may lack the structural support typically seen at the start of sustained bull cycles.
Fractal pattern keeps bull run in check
Historical on-chain behavior, particularly the relationship between Bitcoin [BTC] short-term holders (STH) and long-term holders (LTH), continues to signal caution.
Data from Alphractal shows that the realized price of STH remains above that of LTH. In previous market cycles, a confirmed bull run has only emerged after the STH realized price falls below the LTH level—a transition that reflects stronger long-term accumulation and reduced short-term pressure.
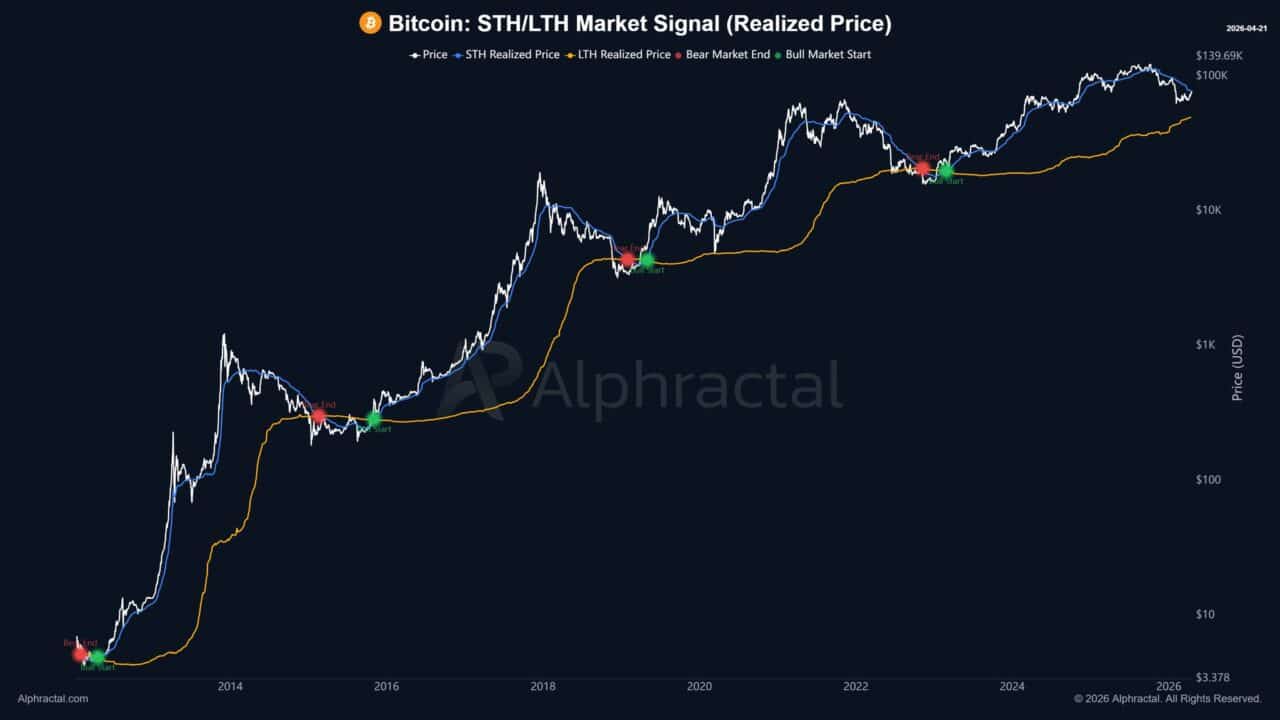
This pattern has appeared consistently across multiple cycles, yet it has not formed in the current market structure. The continued gap between both metrics suggests that bearish conditions may still linger beneath the surface.
Market analyst Joao Pedro noted that the market may require several more weeks before a clear transition out of the bear phase occurs. He added that the recent move could represent a lower high, leaving room for another leg downward.
This bear market may last a bit longer. At least another 5–6 months is what I believe.
Early signs of a potential shift
Despite the absence of a confirmed bullish crossover, some indicators suggest that conditions for a recovery may be developing.
The LTH-STH spent output profit ratio (SOPR) has trended downward, approaching the neutral threshold around 1.0, with current levels near 1.07. Historically, this range reflects a cooling phase in the market, where profit-taking subsides and selling pressure weakens.
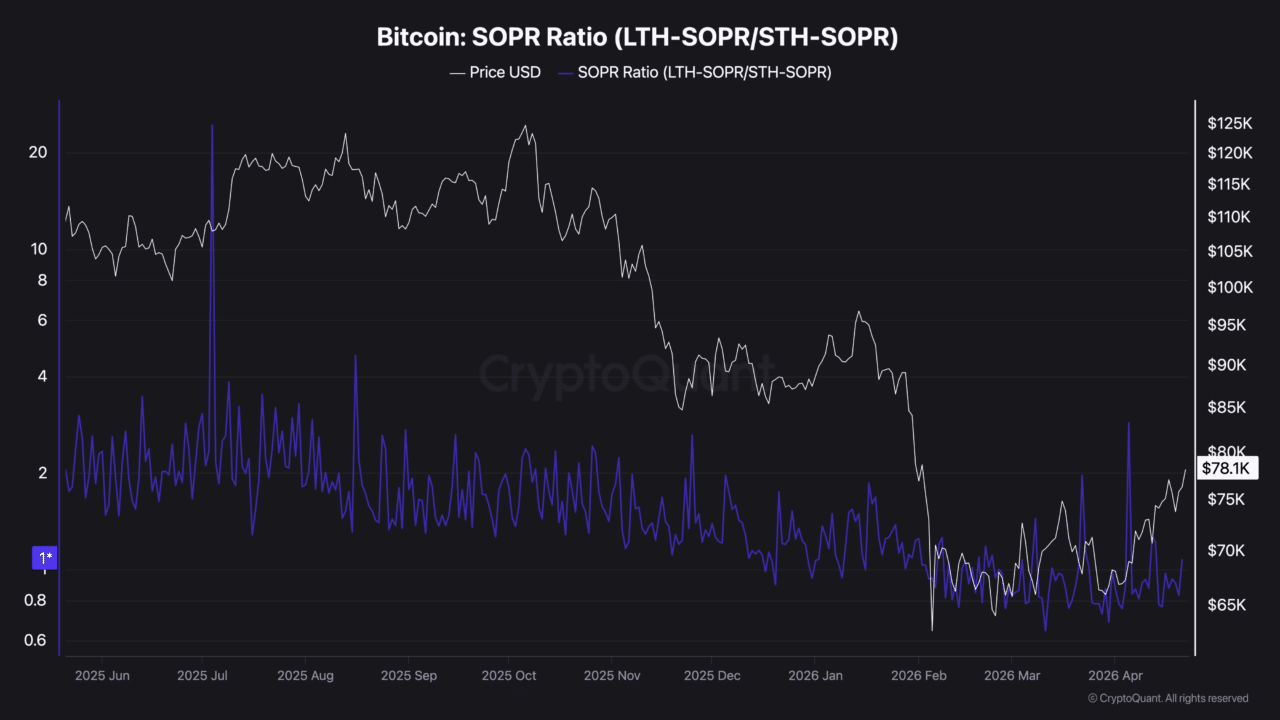
A drop below 1.0 has, in past cycles, marked local bottoms and preceded stronger upward momentum. This leaves the market in a transitional state, where stability is emerging, but further downside cannot be ruled out.
Weak Bitcoin network activity raises caution
On-chain fundamentals continue to diverge from price action, adding to concerns over the rally’s sustainability.
Network activity has declined even as Bitcoin’s price climbs, suggesting that the move may be driven more by speculative demand than organic growth. Lower transaction activity and reduced user engagement often point to weaker underlying support for price expansion.
CryptoQuant data shows that active addresses have fallen from around 663,000 on April 17 to roughly 620,000 in the past 24 hours. On a broader scale, activity has dropped from approximately 865,000 in February, reinforcing the downtrend in network participation.
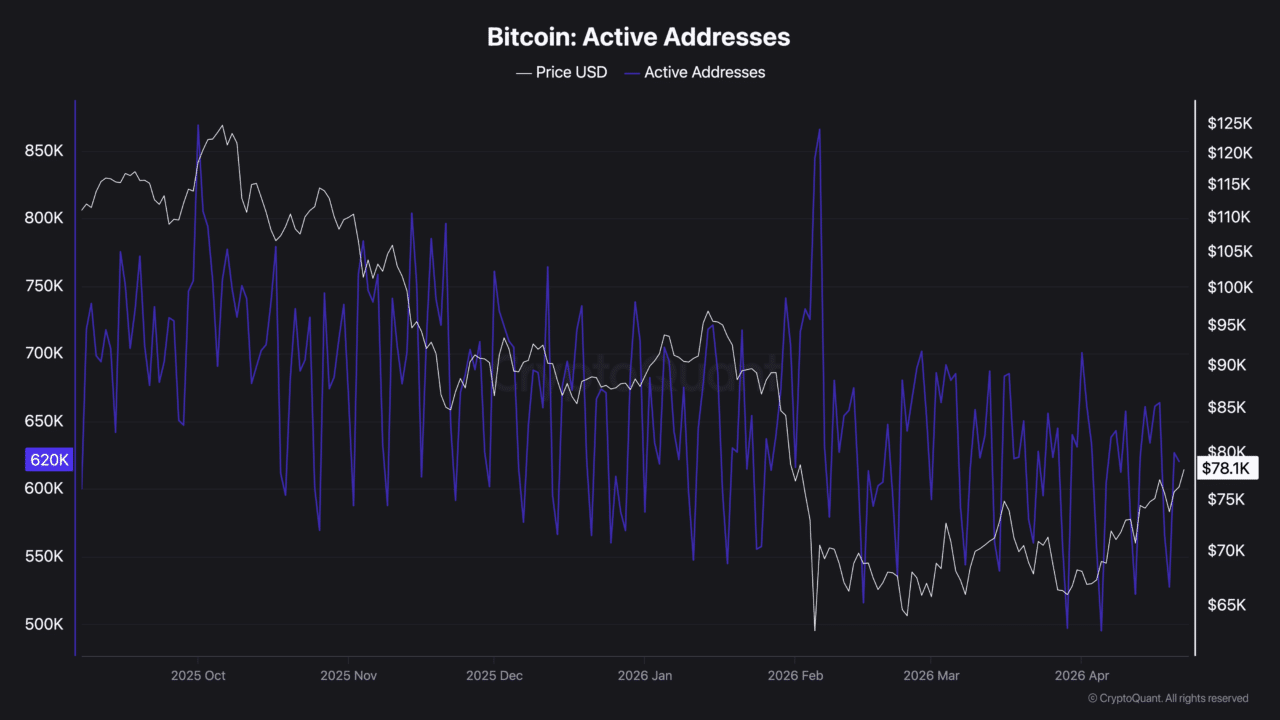
This divergence between price and on-chain demand raises the risk that Bitcoin may be trading above its fundamental value, increasing the likelihood of a correction before a more sustainable uptrend can take hold.
Final Summary
- Bitcoin reclaiming $78,000 has revived bullish sentiment, but the move lacks strong structural confirmation of a new cycle.
- A drop in SOPR below 1.0 could signal a local bottom and stronger upside potential based on past cycles.
