

 2
2
The Bitcoin Bull Score Index indicates that the $BTC market may have now slipped into a recovery path amid recent price gains.
Bitcoin recently retested $76,000 after recording higher highs and higher lows since the March 29 floor. Amid the rebound push, data from CryptoQuant shows the Bull Score Index (BSI) has risen to 40, indicating that the market may have now officially entered a recovery path.
Key Points
- Amid Bitcoin’s recent push to $76,000, the Bull Score Index (BSI) climbed to nearly 40, its highest since October 2025.
- Historical data shows the BSI had fallen from 80 in October 2025 to 10 by early March 2026 before the recent rebound.
- The current reading shows neutral market conditions, but indicates that $BTC may have slipped into a recovery path.
- Analysts warn that Bitcoin must hold above $72,000 or risk losing its latest gains.
Bitcoin Rebounds from March Lows
Verified CryptoQuant analyst Arab Chain called attention to this improving trend amid Bitcoin’s recent price surge. For context, Bitcoin has started to recover after dropping to $65,000 toward the end of March, as its short-term trend records a bullish change.
Since March 29, the price has moved upward overall, forming higher highs and higher lows, despite a few intermittent daily pullbacks along the way.
The recovery picked up pace earlier this week, pushing Bitcoin to $76,000 on Tuesday, April 14, its highest level in about a month. Although the price has pulled back slightly from this level, it has held its upward direction and is now trading around $74,300, suggesting that the recovery is still intact.
Bitcoin Bull Score Index Shows Recovering Market
As the price trend improves, analyst Arab Chain notes that Bitcoin’s Bull Score Index (BSI) now shows early signs of recovery after months of weak performance. The index has risen to nearly 40 points, its highest level since October 2025, as $BTC trades around $74,000.
He clarified that this level still falls within a neutral range, but it shows that market conditions are improving. In recent months, the index moved up and down, with several drops before settling around its current level.
This pattern suggests that supply and demand are now more balanced. Essentially, the market is no longer in a strong uptrend, but it is also not showing clear weakness.
Arab Chain also pointed out that the index remains below the strong bullish level above 60, but stays above the extreme pessimism zone below 40. This places Bitcoin in a middle phase, where investors are waiting for new signals to decide the next direction.
He added that the market looks more stable now, even though momentum is still weaker than it was in October 2025. If the index continues to rise, it could support a stronger upward move in the coming period.
Historical Data Confirms Recovery Bias
Historical data confirms that the Bull Score Index stood at 80 in early October 2025 but dropped to 40 by Oct. 10, 2025, as Bitcoin fell from its $126,000 all-time high to $120,000. This marked the start of a broader decline.
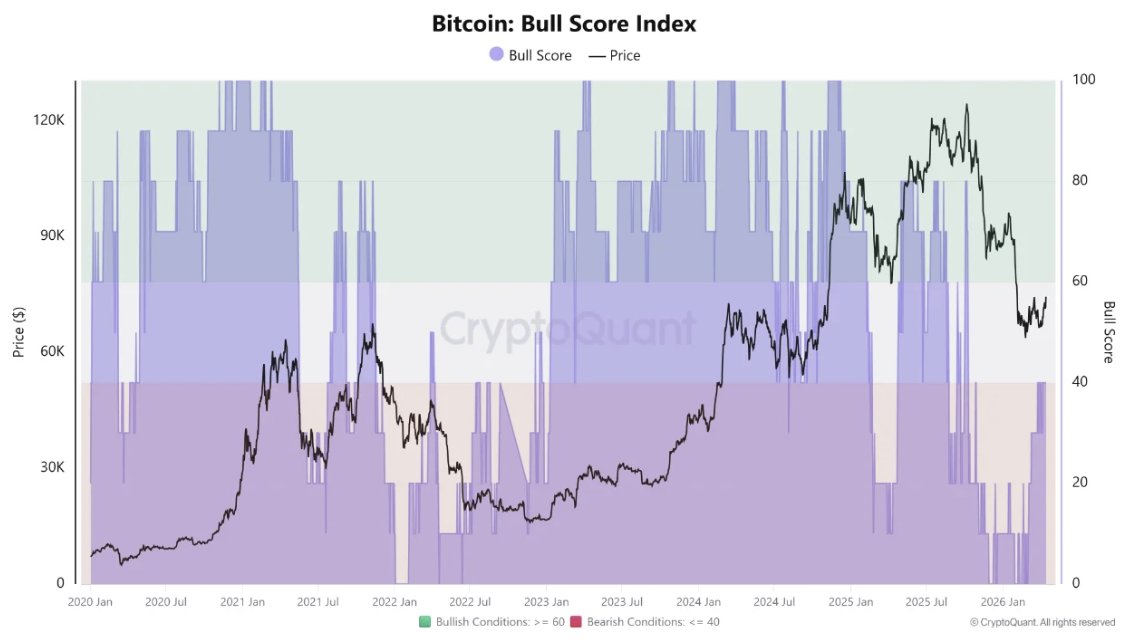
By the end of October 2025, Bitcoin had dropped further to $110,000, while the index fell to 20. The weakness continued into November and December 2025, when the index reached 10.
The metric later recovered slightly to 20 in January 2026, but then slipped again to 10 by early March. Since then, the index has gradually climbed back to around 40, supporting the idea that the market is slowly recovering.
What Next for Bitcoin?
Despite the signs of recovery, what comes next remains unclear. Analyst Ted Pillows noted that buying activity linked to Michael Saylor may pause for about one to two weeks, which could reduce demand in the spot market.
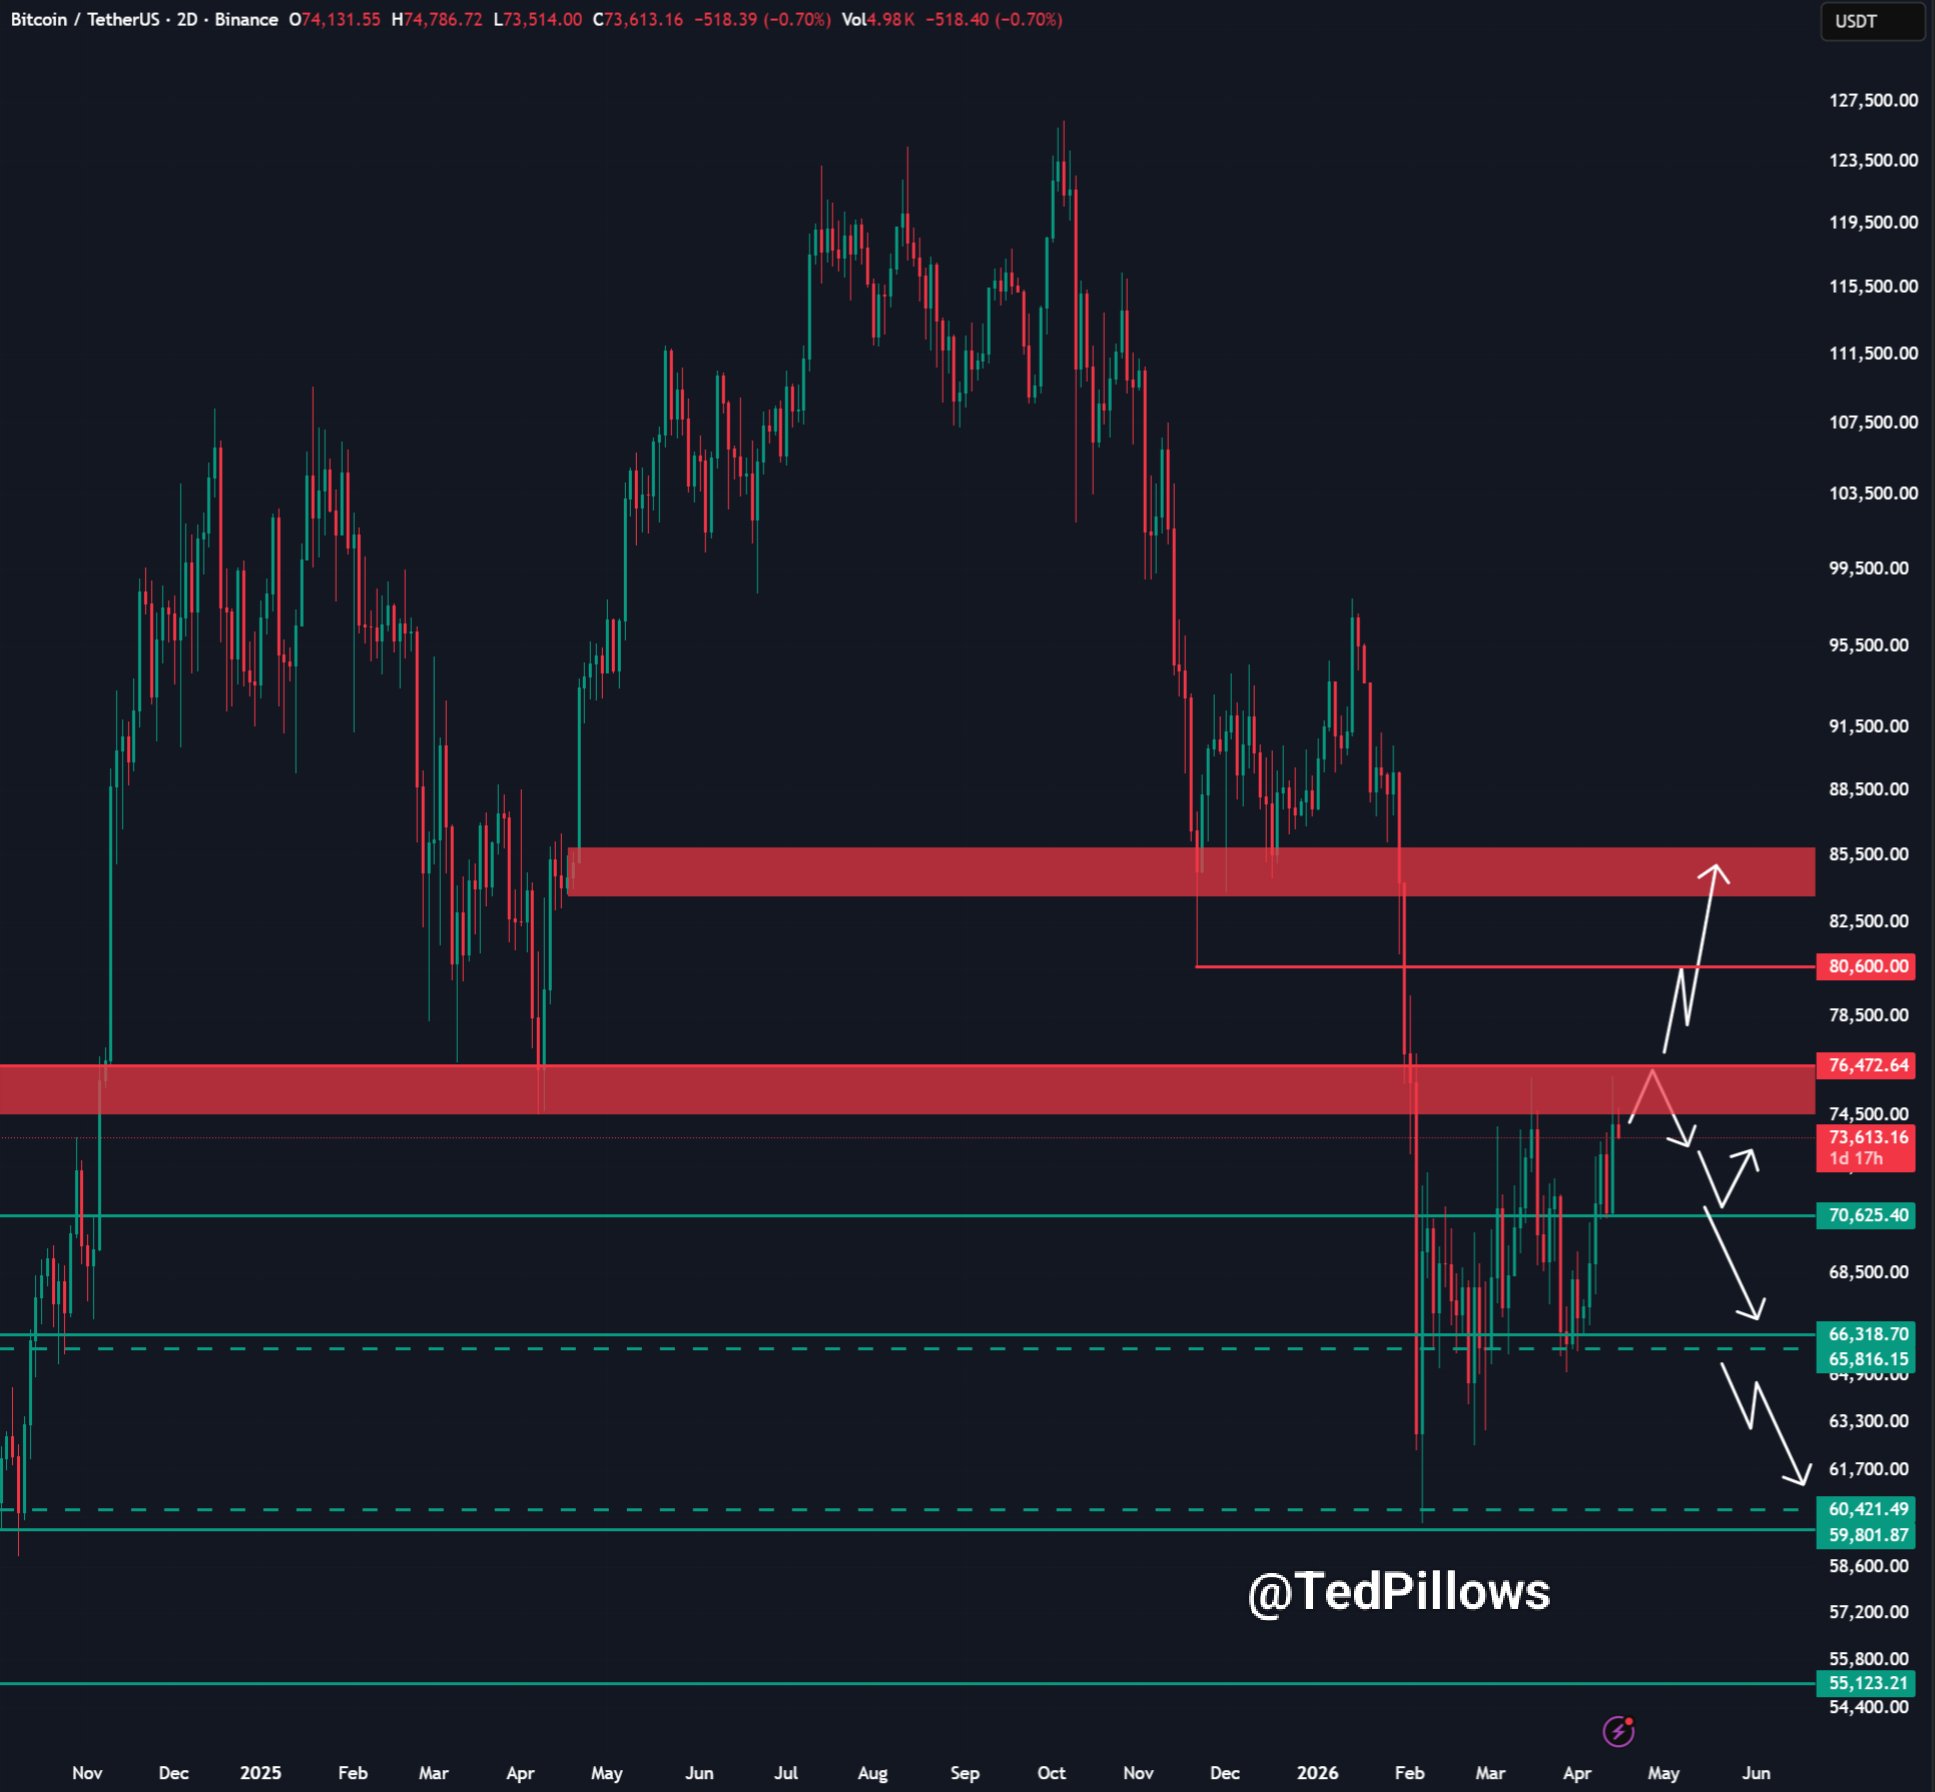
He stressed that Bitcoin needs to stay above $72,000 to keep its current gains, warning that a drop below that level could erase the recent rally.
Meanwhile, market watcher Aralez said the market has already taken liquidity between $75,000 and $76,000. From here, he shared two possible paths. In one case, Bitcoin could pull back to around $73,000, slow down, form a base, and then move higher toward $77,000 and above.
$BTC
As I said yesterday, liquidity pool at $75k-$76k has been taken…
What to expect next?
Market has shown a strong breakout move over past days from $70k to $76k. Right now, I see two most likely scenarios:
1. Pullback into FVG around ~$73k → price slowdown → formation… https://t.co/8uaHcVX07z pic.twitter.com/uAKHF8pTmB
— Aralez 🐕 (@0xAralez) April 14, 2026
In the second scenario, which he currently considers more likely, Bitcoin could drop through $73,000, fall below $71,000, and continue down toward the $69,000 to $70,000 range. Still, he noted that he is waiting for clearer signals before making a move.
