


 7
7
Markets are increasingly pricing in “peace” as a key macro driver in the current cycle.
Notably, the current setup appears to be supporting that narrative. According to The Kobeissi Letter, another agreement may now be on the table.
A new round of negotiations between the U.S. and Iran could take place as soon as Thursday, the 16th of April, following earlier failed attempts to reach a deal.
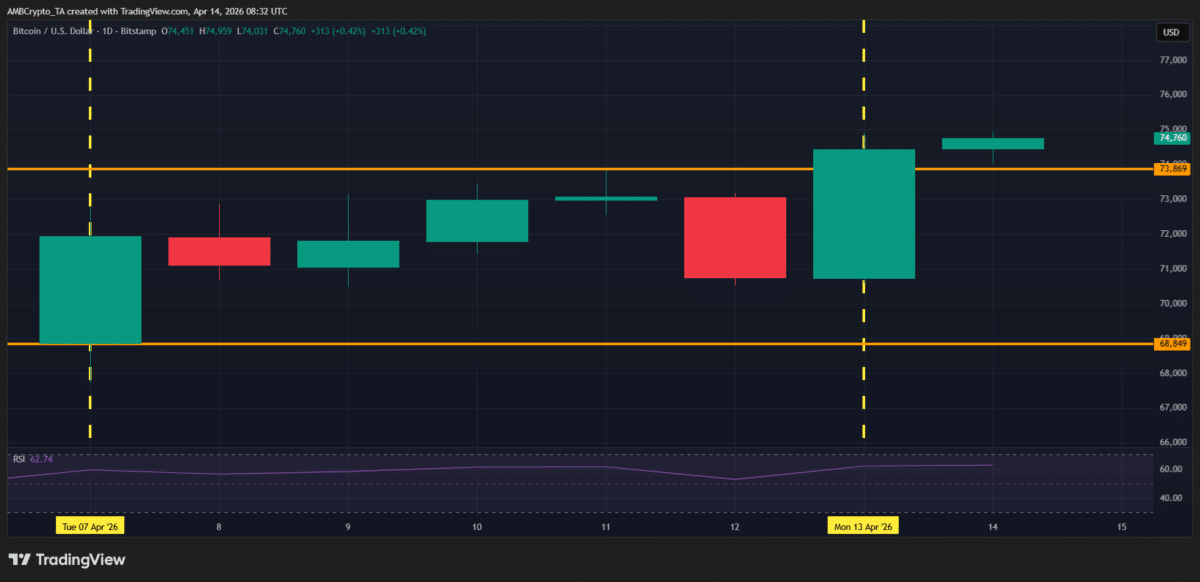
The market reaction has been notable. Following the news, Bitcoin [$BTC] closed the day up 5.23%, with the wick extending as high as $74,911.
This reinforces the idea that investors are closely tracking geopolitical developments, with macro headlines continuing to act as a key driver for price action.
And the impact didn’t stop there.
According to CoinGlass, total liquidations have now crossed $530 million, with nearly 82% coming from short positions.
Notably, Bitcoin followed a similar liquidity-driven structure, with $219 million marking the largest short squeeze in a week. However, zooming out, this isn’t an isolated move.
On the 7th of April, $BTC showed a similar setup, rallying 4.48% to $73k while triggering over $200 million in short liquidations. However, momentum stalled into resistance near $75k.
That shift eventually flipped positioning, leading to $75 million in long liquidations on the 12th of April as the market reversed.
Naturally, the question now is whether Bitcoin is setting up to repeat this same playbook again or if this cycle starts to diverge from previous liquidity patterns. According to AMBCrypto, a key divergence this cycle may be the changing structure.
Sentiment shift signals a break in Bitcoin’s resistance pattern
The more the market aligns with the environment, the more “sentiment” starts to emerge as a key signal.
Nothing illustrates this better than the last few days. Investor sentiment has been tightly tracking the daily swings in geopolitical headlines, particularly around the U.S.-Iran situation, with risk appetite shifting almost in real time alongside each development.
Bitcoin, in turn, has been caught right in the middle of this flow.
The Crypto Fear and Greed Index highlights this dynamic clearly. Twice since the Iran-U.S. conflict emerged, the index has hit resistance, aligning with $BTC’s own rejection zone around $75k.
The first instance came on the 16th of March, when the index dropped 8 points in a week. A similar setup formed on the 7th of April, when the index hit 47, followed by a 5-point dip shortly after.
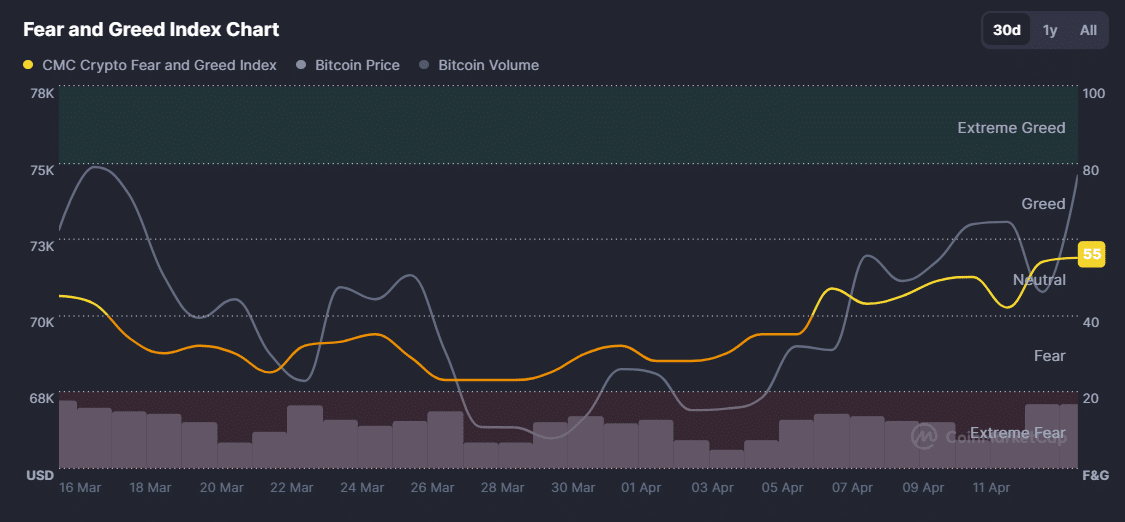
However, this time, the expected follow-through didn’t fully play out.
As the chart shows, the index is now just 5 points away from entering the “greed” zone, which historically aligns with stronger accumulation phases.
This sentiment shift suggests that the recent U.S.–Iran developments have triggered a clear risk-on move, which has been reflected in market sentiment, marking a key divergence from previous cycles.
From a technical standpoint, this points to a strong Bitcoin setup around the $75k level.
If sentiment holds in the wake of the Iran-U.S. deal, $BTC’s current upside could break away from earlier rejection patterns at this resistance zone, making it a key metric to watch going forward.
Final Summary
- Bitcoin’s recent highlight is a liquidity-driven move that aligns with recurring “short squeeze into resistance” structures around the $75k zone.
- The Crypto Fear & Greed Index is approaching “greed,” suggesting improving risk sentiment tied to the Iran-U.S. deal.